Crystal structure and allosteric activation of protein kinase C βII - PubMed (original) (raw)
Crystal structure and allosteric activation of protein kinase C βII
Thomas A Leonard et al. Cell. 2011.
Abstract
Protein kinase C (PKC) isozymes are the paradigmatic effectors of lipid signaling. PKCs translocate to cell membranes and are allosterically activated upon binding of the lipid diacylglycerol to their C1A and C1B domains. The crystal structure of full-length protein kinase C βII was determined at 4.0 Å, revealing the conformation of an unexpected intermediate in the activation pathway. Here, the kinase active site is accessible to substrate, yet the conformation of the active site corresponds to a low-activity state because the ATP-binding side chain of Phe629 of the conserved NFD motif is displaced. The C1B domain clamps the NFD helix in a low-activity conformation, which is reversed upon membrane binding. A low-resolution solution structure of the closed conformation of PKCβII was derived from small-angle X-ray scattering. Together, these results show how PKCβII is allosterically regulated in two steps, with the second step defining a novel protein kinase regulatory mechanism.
Copyright © 2011 Elsevier Inc. All rights reserved.
Figures
Figure 1. Structure of PKCβII
(A) Schematic of the domain structure of PKCβII. (B) Structure of the ordered portion of full-length PKCβII, comprising the C1B (blue), C2 (green) and kinase domains. Magenta denotes the C-lobe, and yellow the N-lobe of the kinase domain. The NFD helix is colored cyan, calcium ions salmon, and AMPPNP orange. Phospho-Thr500, Thr641 and Ser660 are shown in a stick model. (C) Difference map (Fo−Fc) phased using a model subjected to a single pass of DEN-restrained refinement, prior to inclusion of residues 620-639. The map is contoured at 2σ.
Figure 2. The kinase catalytic domain and the NFD helix
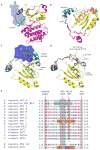
(A) Comparison of the NFD helix in the isolated PKCβII catalytic domain structure (grey) and the present full-length PKCβII structure, where the NFD helix and adjacent regions are colored cyan. (B) Close-up of the NFD region. (C) Comparison of the NFD region in full length PKCβII (cyan) and the ATP-bound kinase domain of PKCι (orange) (Takimura et al., 2010). (D) Sequence alignment of the NFD region of mammalian PKCs, PKCs from C. elegans and C. albicans (yeast), compared to AGC kinase family members PKA and Akt. An invariant proline corresponding to PKCβII Pro619 is at the start of the AGC-specific tail. The inactive NFD helix of our structure is indicated on the alignment (cyan box corresponds to helix in C), as are the rearranged, active NFD motifs of PKCι (orange boxes correspond to helices in C–D) and Akt2 (orange boxes).
Figure 3. The C1B clamp
(A–B) The interface between the C1B domain and the N-lobe of the catalytic domain stabilizes the clamp by positioning the C1B appropriately with respect to the NFD helix. This interface is predominantly hydrophobic, with the N-lobe side chains of Leu345, Leu358, Leu367 and Y422 (yellow, stick model) packing against Leu125, Ile126 and K141 (blue, surface model) of the C1B domain. Y430 is contributed by the C-lobe of the kinase domain (magenta). (C) The C1B domain clamps the NFD helix and residues immediately N-terminal to the helix. Residues Pro619 – Cys622 (cyan, stick model) are in an extended conformation that makes intimate contacts with the phorbol ester binding cleft of the C1B domain. (D) Comparison of the C1B domain of PKCδ bound to PMA (Zhang et al., 1995) with that of PKCβII shows a steric clash between phorbol ester and residues 619–622 running through the cleft.
Figure 4. Mutational analysis of the C1B clamp in PKCβII translocation
(A) Plot of in vivo membrane translocation of PKCβII against [PMA]. Data points are the mean of two measurements, and errors bars indicate the standard deviation from the mean. (B) PKCβII translocation was quantitated as the reduction in the cytosolic pool of PKC following exposure to PMA. Shown are the Western blots for wild type PKCβII and the indicated mutants. The intensity of the normalized bands is plotted in A. EC50 values are reported for each mutant. Both soluble cytosolic (S) and membrane pellet (P) fractions are shown for L358D.
Figure 5. SAXS of PKCβII
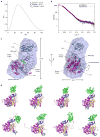
(A) Pair distribution function (P(r)) for autoinhibited PKCβII. The radius of gyration is estimated to be 33.6 Å and 33.5 Å by Guinier analysis and the P(r) function respectively. The maximum dimension of the particle is estimated to be 100 Å. (B) Fit of the simulated scattering curves (I(q)) to the observed scattering of autoinhibited PKCβII. Experimental I(q) data points represent the mean of ten consecutive measurements of the same sample, and the error bars represent the standard error of the mean. (C) Superimposition of the best fit solution to the SAXS curve with an ab initio molecular envelope generated by DAMMIF, in two views rotated by 90 degrees from one another. The assembly of PKCβII kinase and regulatory domains fits inside the envelope. (D) A sample of the top solutions to the simulation of full length, autoinhibited PKCβII indicating the uncertainty in the placement of the C1A domain (shown in blue).
Figure 6. Model for multistep activation of PKCβII
PKCβII translocates to the membrane upon Ca2+ release in the cell, where the calcium binding regions of its C2 domain mediate bridging to the anionic phospholipid phosphatidylserine, with an adjoining site on the C2 domain binding phosphatidylinositol (4,5)-bisphosphate (1). Subsequent binding of DAG to the C1A domain results in disengagement of the C1A domain (2), which in turn forces the removal of the pseudosubstrate (PS) from the catalytic cleft. Binding of a second molecule of DAG by the C1B domain results in unclamping of the kinase:C1B assembly (3) and rearrangement of the NFD helix into the catalytically competent state (4), triggering the phosphorylation of cellular targets (5) and subsequent downstream signaling. The C2 domain was docked to the membrane in the geometry described by (Landgraf et al., 2008), and the C1 domains as modeled by (Zhang et al., 1995).
Comment in
- Protein kinase C regulation: C1 meets C-tail.
Kazanietz MG, Lemmon MA. Kazanietz MG, et al. Structure. 2011 Feb 9;19(2):144-6. doi: 10.1016/j.str.2011.01.004. Structure. 2011. PMID: 21300283
Similar articles
- Novel Features of DAG-Activated PKC Isozymes Reveal a Conserved 3-D Architecture.
Lučić I, Truebestein L, Leonard TA. Lučić I, et al. J Mol Biol. 2016 Jan 16;428(1):121-141. doi: 10.1016/j.jmb.2015.11.001. Epub 2015 Nov 12. J Mol Biol. 2016. PMID: 26582574 - Contribution of the C1A and C1B domains to the membrane interaction of protein kinase C.
Giorgione J, Hysell M, Harvey DF, Newton AC. Giorgione J, et al. Biochemistry. 2003 Sep 30;42(38):11194-202. doi: 10.1021/bi0350046. Biochemistry. 2003. PMID: 14503869 - Activation mechanisms of conventional protein kinase C isoforms are determined by the ligand affinity and conformational flexibility of their C1 domains.
Ananthanarayanan B, Stahelin RV, Digman MA, Cho W. Ananthanarayanan B, et al. J Biol Chem. 2003 Nov 21;278(47):46886-94. doi: 10.1074/jbc.M307853200. Epub 2003 Sep 3. J Biol Chem. 2003. PMID: 12954613 - Indolactam and benzolactam compounds as new medicinal leads with binding selectivity for C1 domains of protein kinase C isozymes.
Irie K, Nakagawa Y, Ohigashi H. Irie K, et al. Curr Pharm Des. 2004;10(12):1371-85. doi: 10.2174/1381612043384907. Curr Pharm Des. 2004. PMID: 15134488 Review. - C1 domains exposed: from diacylglycerol binding to protein-protein interactions.
Colón-González F, Kazanietz MG. Colón-González F, et al. Biochim Biophys Acta. 2006 Aug;1761(8):827-37. doi: 10.1016/j.bbalip.2006.05.001. Epub 2006 May 13. Biochim Biophys Acta. 2006. PMID: 16861033 Review.
Cited by
- Lipid-Binding Regions within PKC-Related Serine/Threonine Protein Kinase N1 (PKN1) Required for Its Regulation.
Lin JLJ, Yuan HS. Lin JLJ, et al. Biochemistry. 2024 Mar 19;63(6):743-753. doi: 10.1021/acs.biochem.4c00009. Epub 2024 Mar 5. Biochemistry. 2024. PMID: 38441874 Free PMC article. - Phosphoinositide switches in cell physiology - From molecular mechanisms to disease.
Lolicato F, Nickel W, Haucke V, Ebner M. Lolicato F, et al. J Biol Chem. 2024 Mar;300(3):105757. doi: 10.1016/j.jbc.2024.105757. Epub 2024 Feb 15. J Biol Chem. 2024. PMID: 38364889 Free PMC article. Review. - An Update on Protein Kinases as Therapeutic Targets-Part II: Peptides as Allosteric Protein Kinase C Modulators Targeting Protein-Protein Interactions.
Zerihun M, Rubin SJS, Silnitsky S, Qvit N. Zerihun M, et al. Int J Mol Sci. 2023 Dec 15;24(24):17504. doi: 10.3390/ijms242417504. Int J Mol Sci. 2023. PMID: 38139336 Free PMC article. Review. - MMD collaborates with ACSL4 and MBOAT7 to promote polyunsaturated phosphatidylinositol remodeling and susceptibility to ferroptosis.
Phadnis VV, Snider J, Varadharajan V, Ramachandiran I, Deik AA, Lai ZW, Kunchok T, Eaton EN, Sebastiany C, Lyakisheva A, Vaccaro KD, Allen J, Yao Z, Wong V, Geng B, Weiskopf K, Clish CB, Brown JM, Stagljar I, Weinberg RA, Henry WS. Phadnis VV, et al. Cell Rep. 2023 Sep 26;42(9):113023. doi: 10.1016/j.celrep.2023.113023. Epub 2023 Sep 8. Cell Rep. 2023. PMID: 37691145 Free PMC article. - Single-residue mutation in protein kinase C toggles between cancer and neurodegeneration.
Jones AC, Kornev AP, Weng JH, Manning G, Taylor SS, Newton AC. Jones AC, et al. Biochem J. 2023 Aug 30;480(16):1299-1316. doi: 10.1042/BCJ20220397. Biochem J. 2023. PMID: 37551632 Free PMC article.
References
- Berger I, Fitzgerald DJ, Richmond TJ. Baculovirus expression system for heterologous multiprotein complexes. Nat Biotechnol. 2004;22:1583–1587. - PubMed
- Bogi K, Lorenzo PS, Acs P, Szallasi Z, Wagner GS, Blumberg PM. Comparison of the roles of the C1a and C1b domains of protein kinase C alpha in ligand induced translocation in NIH 3T3 cells. FEBS Lett. 1999;456:27–30. - PubMed
- Canagarajah B, Collucio Leskow F, Ho YSJ, Mischak H, Saidi L, Kazanietz MG, Hurley JH. Structural Mechanism for Lipid Activation of the Rac-Specific GAP, beta2-Chimaerin. Cell. 2004;119:407–418. - PubMed
- Chou MM, Hou WM, Johnson J, Graham LK, Lee MH, Chen CS, Newton AC, Schaffhausen BS, Toker A. Regulation of protein kinase C zeta by PI 3-kinase and PDK-1. Curr Biol. 1998;8:1069–1077. - PubMed
- Das Evcimen N, King GL. The role of protein kinase C activation and the vascular complications of diabetes. Pharmacol Res. 2007;55:498–510. - PubMed
Publication types
MeSH terms
Substances
Grants and funding
- ZIA DK036127/ImNIH/Intramural NIH HHS/United States
- ZIA DK036127-04/ImNIH/Intramural NIH HHS/United States
- Y1-CO-1020/CO/NCI NIH HHS/United States
- Y1-GM-1104/GM/NIGMS NIH HHS/United States
LinkOut - more resources
Full Text Sources
Other Literature Sources
Molecular Biology Databases
Research Materials


