The epigenetic regulator Histone Deacetylase 1 promotes transcription of a core neurogenic programme in zebrafish embryos - PubMed (original) (raw)
The epigenetic regulator Histone Deacetylase 1 promotes transcription of a core neurogenic programme in zebrafish embryos
Michael R M Harrison et al. BMC Genomics. 2011.
Abstract
Background: The epigenetic regulator Histone Deacetylase 1 (Hdac1) is required for specification and patterning of neurones and myelinating glia during development of the vertebrate central nervous system (CNS). This co-ordinating function for Hdac1 is evolutionarily conserved in zebrafish and mouse, but the mechanism of action of Hdac1 in the developing CNS is not well-understood.
Results: A genome-wide comparative analysis of the transcriptomes of Hdac1-deficient and wild-type zebrafish embryos was performed, which identified an extensive programme of gene expression that is regulated by Hdac1 in the developing embryo. Using time-resolved expression profiling of embryos, we then identified a small subset of 54 genes within the Hdac1-regulated transcriptome that specifically exhibit robust and sustained Hdac1-dependent expression from early neurogenesis onwards. 18 of these 54 stringently Hdac1-regulated genes encode DNA-binding transcription factors that are implicated in promoting neuronal specification and CNS patterning, including the proneural bHLH proteins Ascl1a and Ascl1b, as well as Neurod4 and Neurod. Relatively few genes are strongly repressed by Hdac1 but expression of the Notch target gene her6 is attenuated by Hdac1 in specific sub-regions of the developing CNS, from early stages of neurogenesis onwards. Selected members of the stringently Hdac1-regulated group of genes were tested for Hdac1 binding to their promoter-proximal cis-regulatory elements. Surprisingly, we found that Hdac1 is specifically and stably associated with DNA sequences within the promoter region of ascl1b during neurogenesis, and that this Hdac1-ascl1b interaction is abolished in hdac1 mutant embryos.
Conclusions: We conclude that Hdac1 regulates histone acetylation and methylation in the developing zebrafish embryo and promotes the sustained, co-ordinate transcription of a small set of transcription factor genes that control expansion and diversification of cell fates within the developing CNS. Our in vivo chromatin immunoprecipitation results also suggest a specific function for Hdac1 in directly regulating transcription of a key member of this group of genes, ascl1b, from the beginning of neurogenesis onwards. Taken together, our observations indicate a novel role for Hdac1 as a positive regulator of gene transcription during development of the vertebrate CNS, in addition to its more well-established function in transcriptional repression.
Figures
Figure 1
Hdac1 inhibits Histone acetylation and promotes H3K9 methylation levels in the zebrafish embryo. Levels of Hdac1 protein and covalently modified histones in hdac1 mutant (m) and wild-type (s) embryos aged 27, 33, 39, 48, 56, 73, 80 and 96 hpf, visualised by Western blot analysis using anti-Hdac1 and histone modification-specific antibodies. Hdac1 protein visualised with an anti-Hdac1 antibody is shown on the top row. Antibodies specific for the following histone modifications were: Pan-acetyl lysine; acetyl-H3K9; dimethyl-H3K9, trimethyl-H3K4. An anti-H3 antibody was used as a loading control (bottom row).
Figure 2
Phenotypic analysis of Hdac1-deficient embryos. (A) Scatter plot of probe intensities from hdac1 mutant versus sibling comparisons. Up-regulated and down-regulated probes in hdac1 mutants are coloured red or green, respectively. The averaged ratio values are plotted on the y-axis and the averaged expression values are plotted on the x-axis, both of which are expressed in a log10 scale. The threshold for statistically significant differential expression was set at p < 10-5. (B) Analysis of the fold-change distribution of Hdac1-regulated probes identified in (A). (C) Microinjection of Hdac1 morpholinos reduces Hdac1 protein abundance in zebrafish embryos. Western blotting for Hdac1 protein in hdac1 mutant (Mut), wild-type (Sib), Hdac1ATG1 morphant (ATG), Hdac1SPL1 morphant (SPL), Hdac1Control morphant (HCo) and Standard Control morphant (StCo) embryos. (D) Reduced immunostaining for Hdac1 in hdac1 mutant and Hdac1ATG1 morphant embryos. Transverse confocal sections through the hindbrain of 12 hpf, 18 hpf and 27 hpf wild-type, hdac1 mutant and Hdac1ATG1 morphant embryos immunostained for Hdac1 protein (green in upper and lower panels) and counterstained with DAPI (blue, in lower panel only).
Figure 3
Time-resolved transcriptome analysis identifies an Hdac1-regulated gene expression programme that is sustained throughout neurogenesis. Cluster3.0 analysis of the transcriptomes of Hdac1ATG1 and Standard Control (StCo) morphant embryos at 12, 18 and 27 hpf. Up-regulated probes are indicated in red; down-regulated probes are indicated in green; unchanged probes are indicated in black. The threshold for statistically significant differential expression was set at p < 10-5 and an additional fold-change minimum of 1.5 was also imposed. All probes on the array are grouped based on their expression changes across the three time points. Large numbers of gene changes were identified as being misregulated at individual time points, however 803 probes were found to be misregulated at all three time points. Only 199 probes were consistently up-regulated (red, arrow) and 335 probes were found to be down-regulated (green, arrow). Probes that exhibited sustained fold-changes in expression >2-fold across all three time points are listed and annotated in Additional file 3, of which those that also exhibited altered expression in hdac1 mutant embryos are listed in Figure 4.
Figure 4
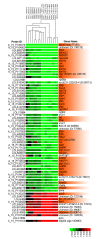
Cluster analysis of hdac1 mutant and morphant transcriptomes identifies a core set of Hdac1-regulated genes. The Cluster Tree displays the relationships between transcriptomes of 27 hpf hdac1 mutant embryos and 12 hpf, 18 hpf and 27 hpf Hdac1ATG1 morphant embryos. The threshold for statistically significant differential expression was set at p <10-5 for all probes and an additional >2-fold-change criterion was then applied to identify a subset of 84 probes whose expression was changed in Hdac1ATG1 morphants at all three times points (Suppl. Table S2). To eliminate probes from this group that did not exhibit altered expression in the 27 hpf hdac1 mutant samples, an exclusion criterion was then applied to eliminate probes that did not exhibit a >1.2-fold change in transcript abundance in 27 hpf hdac1 mutants in comparison to controls. Thus, 67 probes were identified that exhibited a >2-fold change in transcript abundance in Hdac1ATG1 morphants at 12 hpf, 18 hpf and 27 hpf and a >1.2 fold change in transcript abundance in hdac1 mutants, in comparison to controls. All of these expression changes met the threshold for statistical significance of p < 10-5. The expression changes for each of the listed genes are given for each of the individual microarrays analysed. Up-regulated probes are indicated in red; down-regulated probes are indicated in green. The samples include 8 hdac1 mutant/wild-type sibling replicates, plus biological triplicates for each of the 12 hpf, 18 hpf and 27 hpf Hdac1ATG1/Standard Control morphant comparisons (see Methods section for further details). Genes that are expressed in the CNS or have a CNS-oriented function are indicated in orange.
Figure 5
Expression of the Hdac1 neurogenic programme is stably attenuated in Hdac1ATG1 morphant embryos. (A) 6-somite stage (12 hpf) embryos and (B) 27 hpf embryos injected with standard Control + p53 morpholinos or Hdac1ATG1 + p53 morpholinos, analysed for expression of neurod4, ascl1b, neurod, dlb, lhx9 and sox2. Expression of neurod4, ascl1b, neurod, dlb and lhx9 was reduced in Hdac1-deficient embryos. In contrast, the expression pattern of sox2, which did not exhibit a statistically significant change in transcript abundance in the microarray analysis, was unaltered in 12 hpf Hdac1ATG1 morphant embryos.
Figure 6
Expression of the Hdac1 neurogenic programme is stably attenuated in hdac1 mutant embryos. (A) 12 hpf embryos were sorted according to ascl1b expression level and individuals were then genotyped by PCR. All embryos with strong ascl1b expression had the wild type hdac1 allele (lower band) and were therefore wild-type siblings, whereas embryos with a weak ascl1b expression pattern carried only the mutant hdac1 allele (upper band) and were therefore hdac1 mutants. (B) Similar results to those shown in (A) were obtained for 18 hpf embryos. In both (A) and (B), the forebrain (f) and hindbrain (h) regions of Hdac1-regulated ascl1b expression are indicated. (C) Expression of the Hdac1 neurogenic programme is attenuated in 27 hpf hdac1 mutant embryos. Expression of neurod4, ascl1b, neurod, dlb and lhx9 in 27 hpf _hdac1_mutant and wild-type sibling embryos. Expression of each of these genes is reduced in the CNS of hdac1 mutant embryos.
Figure 7
Increased her6 expression in the CNS of Hdac1ATG1 morphants and TSA-treated embryos during early neurogenesis. (A-F) Wild-type sibling (A, C, E) and Hdac1ATG1 morphant (B, D, F) embryos were analysed for expression of her6 at 12 hpf (A, B, C, D) and 18 hpf (E, F). (G-J) Embryos were cultured in the absence (G, I) or presence (H, J) of the HDAC inhibitor TSA (1 μM) from 10-14 hpf, then analysed for expression of her6. In dorsal and lateral views, anterior is to the left. Green arrowheads indicate caudal hindbrain, which exhibits increased her6 expression in Hdac1ATG1 morphants at 12 hpf and in TSA-treated embryos at 14 hpf; red arrows indicate optic vesicles, which exhibit increased her6 expression in Hdac1ATG1 morphants at 12 hpf and in TSA-treated embryos at 14 hpf; blue asterisks indicate hindbrain, which exhibits increased increased her6 expression in Hdac1ATG1 morphant embryos at 18 hpf.
Figure 8
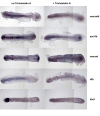
Trichostatin A (TSA) extinguishes neurod4, ascl1b, neurod, dlb and lhx9 expression during early neurogenesis. Embryos were cultured in the absence or presence of TSA (1 μM) from 10-14 hpf, then analysed for expression of genes as indicated. In all panels, anterior is to the left.
Figure 9
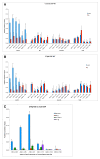
Chromatin immunoprecipitation analysis of Hdac1 binding to _cis_-regulatory regions of Hdac1-regulated genes. (A, B) Hdac1 is stably and specifically associated with DNA sequences close to the transcription start site of the ascl1b gene in (A) 12 hpf and (B) 27 hpf zebrafish embryos. Chromatin was immunoprecipitated with anti-Hdac1 antibody (blue) and control IgG (red) and DNA content analysed by Q-PCR, which revealed Hdac1 is stably associated with DNA sequences between -785bp and -85bp upstream of ascl1b in wild-type embryos. In contrast, Hdac1 was not detectably associated with similarly positioned DNA sequences close to neurod4, dlb or her6. (C) Immunoprecipitation of ascl1b promoter sequences from chromatin with an Hdac1-specific antibody is abolished in 27 hpf hdac1 mutant embryos. Comparison of Hdac1 protein binding to chromatin encompassing the ascl1b transcription start site in 27 hpf wild-type sibling (SIB) and hdac1 mutant (MUT) embryos. Chromatin was immunoprecipitated with anti-Hdac1 antibody (blue, green bars) or control IgG (red, purple bars) and DNA content analysed by Q-PCR. Physical association of Hdac1 with DNA sequences between -785bp and -85bp upstream of ascl1b was detected in wild-type sibling embryos, but not in hdac1 mutant embryos. Bar graphs show mean values with standard deviations for technical triplicates. Asterisks indicate statistical significance (P < 0.05).
Similar articles
- Valproic acid silencing of ascl1b/Ascl1 results in the failure of serotonergic differentiation in a zebrafish model of fetal valproate syndrome.
Jacob J, Ribes V, Moore S, Constable SC, Sasai N, Gerety SS, Martin DJ, Sergeant CP, Wilkinson DG, Briscoe J. Jacob J, et al. Dis Model Mech. 2014 Jan;7(1):107-17. doi: 10.1242/dmm.013219. Epub 2013 Oct 17. Dis Model Mech. 2014. PMID: 24135485 Free PMC article. - Gene transcription in the zebrafish embryo: regulators and networks.
Ferg M, Armant O, Yang L, Dickmeis T, Rastegar S, Strähle U. Ferg M, et al. Brief Funct Genomics. 2014 Mar;13(2):131-43. doi: 10.1093/bfgp/elt044. Epub 2013 Oct 22. Brief Funct Genomics. 2014. PMID: 24152666 Review. - HDAC1 and HDAC2 in mouse oocytes and preimplantation embryos: Specificity versus compensation.
Ma P, Schultz RM. Ma P, et al. Cell Death Differ. 2016 Jul;23(7):1119-27. doi: 10.1038/cdd.2016.31. Epub 2016 Apr 15. Cell Death Differ. 2016. PMID: 27082454 Free PMC article. Review.
Cited by
- Histone deacetylase activity is required for embryonic posterior lateral line development.
He Y, Wu J, Mei H, Yu H, Sun S, Shou J, Li H. He Y, et al. Cell Prolif. 2014 Feb;47(1):91-104. doi: 10.1111/cpr.12081. Epub 2013 Nov 23. Cell Prolif. 2014. PMID: 24267956 Free PMC article. - Epigenetics, development, and cancer: zebrafish make their mark.
Mudbhary R, Sadler KC. Mudbhary R, et al. Birth Defects Res C Embryo Today. 2011 Jun;93(2):194-203. doi: 10.1002/bdrc.20207. Birth Defects Res C Embryo Today. 2011. PMID: 21671358 Free PMC article. Review. - Genome wide expression profiling during spinal cord regeneration identifies comprehensive cellular responses in zebrafish.
Hui SP, Sengupta D, Lee SG, Sen T, Kundu S, Mathavan S, Ghosh S. Hui SP, et al. PLoS One. 2014 Jan 20;9(1):e84212. doi: 10.1371/journal.pone.0084212. eCollection 2014. PLoS One. 2014. PMID: 24465396 Free PMC article. - LIM Homeobox 9 knockdown by morpholino does not affect zebrafish retinal development.
Guo R, Li F, Lu M, Ge K, Gan L, Sheng D. Guo R, et al. Biol Open. 2021 Mar 8;10(3):bio056382. doi: 10.1242/bio.056382. Biol Open. 2021. PMID: 33579692 Free PMC article. - Pattern of change in histone 3 lysine 9 acetylation and histone deacetylases in development of zebrafish embryo.
Li Y, Wang J, Xie Y, Liu S, Tian Y. Li Y, et al. J Genet. 2014 Aug;93(2):539-44. doi: 10.1007/s12041-014-0403-y. J Genet. 2014. PMID: 25189256 No abstract available.
References
Publication types
MeSH terms
Substances
Grants and funding
- G0400100/Medical Research Council/United Kingdom
- G0700091/Medical Research Council/United Kingdom
- GR077544AIA/Wellcome Trust/United Kingdom
- WT081884MA/Wellcome Trust/United Kingdom
LinkOut - more resources
Full Text Sources
Molecular Biology Databases
Miscellaneous


