The human syndrome of dendritic cell, monocyte, B and NK lymphoid deficiency - PubMed (original) (raw)
Case Reports
. 2011 Feb 14;208(2):227-34.
doi: 10.1084/jem.20101459. Epub 2011 Jan 17.
Muzlifah Haniffa, Sergei Doulatov, Xiao-Nong Wang, Rachel Dickinson, Naomi McGovern, Laura Jardine, Sarah Pagan, Ian Dimmick, Ignatius Chua, Jonathan Wallis, Jim Lordan, Cliff Morgan, Dinakantha S Kumararatne, Rainer Doffinger, Mirjam van der Burg, Jacques van Dongen, Andrew Cant, John E Dick, Sophie Hambleton, Matthew Collin
Affiliations
- PMID: 21242295
- PMCID: PMC3039861
- DOI: 10.1084/jem.20101459
Case Reports
The human syndrome of dendritic cell, monocyte, B and NK lymphoid deficiency
Venetia Bigley et al. J Exp Med. 2011.
Abstract
Congenital or acquired cellular deficiencies in humans have the potential to reveal much about normal hematopoiesis and immune function. We show that a recently described syndrome of monocytopenia, B and NK lymphoid deficiency additionally includes the near absence of dendritic cells. Four subjects showed severe depletion of the peripheral blood HLA-DR(+) lineage(-) compartment, with virtually no CD123(+) or CD11c(+) dendritic cells (DCs) and very few CD14(+) or CD16(+) monocytes. The only remaining HLA-DR(+) lineage(-) cells were circulating CD34(+) progenitor cells. Dermal CD14(+) and CD1a(+) DC were also absent, consistent with their dependence on blood-derived precursors. In contrast, epidermal Langerhans cells and tissue macrophages were largely preserved. Combined loss of peripheral DCs, monocytes, and B and NK lymphocytes was mirrored in the bone marrow by complete absence of multilymphoid progenitors and depletion of granulocyte-macrophage progenitors. Depletion of the HLA-DR(+) peripheral blood compartment was associated with elevated serum fms-like tyrosine kinase ligand and reduced circulating CD4(+)CD25(hi)FoxP3(+) T cells, supporting a role for DC in T reg cell homeostasis.
Figures
Figure 1.
Deficiency of peripheral blood DCs, monocytes, and lymphoid cells. Flow cytometry of PBMCs and proportion of lymphoid, monocyte, and DC fractions in the subjects relative to controls. Plots show equivalent numbers of total cells analyzed (75,000 for DCs; 65,000 for lymphocytes). Error bars indicate mean ± SD from a population of normal individuals (n = 11 for lymphoid cells; n = 28 for HLA-DR+ lineage− cells). One of at least two independent results is shown for subjects 1–4. (A) CD3+ T cells, CD19+ B cells, and CD56+ NK cells. (B) HLA-DR+ lineage− (CD3/19/56) cells further divided into CD14+ and CD16+ monocyte fractions and double-negative CD14−CD16− cells, which comprise CD34+ progenitor cells, CD123+ PDCs, and CD11c+ myeloid DC fractions. (C) Quantitative analysis of monocyte/DC fractions, expressed as percentage of mononuclear cells, and lymphoid cells, expressed as percentage of cells in the lymphoid SSC/FSC gate, compared with healthy controls.
Figure 2.
Dysfunction of the IL-12–IFN-γ axis. Cytokines released into the supernatant when whole blood was stimulated in vitro with LPS, IL-12, or IFN-γ as indicated. A paired “travel control” was run with each subject, and each subject was analyzed at least twice. The graph shows the mean ± SD for subjects (n = 4) compared with controls (n = 4) from one experiment. *, P < 0.05 compared with adjacent control (paired Student’s t test).
Figure 3.
Depletion of tissue DCs, but preservation of LCs and macrophages. (A) Analysis of dermal DC populations by flow cytometry of collagenase-digested dermis. Plots show equivalent number of total cells analyzed (40,000). Gated CD45+ HLA-DR+ cells normally comprise two fractions separable by autofluorescence (AF) and side scatter (SSC). AF− SSClow cells (gate 1) contain CD14+ DCs, CD1a+ DCs, and occasional CD1ahigh langerin+ migrating LCs (gate 3); AF+ SSChigh cells are macrophages (gate 2). CD1ahigh cells express langerin (subject 1, inset). Subjects 1 and 3 were analyzed twice, independently; subjects 2 and 4 were analyzed once. (B) Dermal DCs, LCs, and macrophage counts relative to normal controls (n = 22; mean ± SD). (C) Whole-mount immunofluorescence staining for CD1a of epidermal sheets showing representative fields of each subject. (D) Total LC counts averaged from entire low-power image relative to controls (n = 12; mean ± SD). (E) Proportion of Ki-67+ LCs in whole-mount epidermal sheets relative to controls (n = 3).
Figure 4.
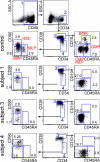
Depletion of specific compartments of CD34+ BM cells. Flow cytometric analysis of CD34+ progenitor compartments in BM according to a recent protocol (Doulatov et al., 2010). Control (performed 7 times); subjects 1, 3, and 4, as indicated (performed twice). Total BM mononuclear cells are shown. The minimum number of CD34+ cells analyzed was 4,500. Numbers show the percentage of CD34+ cells in each gate. Gate 1 contains CD45+ cells; gate 2 contains CD34+ cells; gate 3 contains committed CD38+ fraction; gate 4 contains a primitive CD38− fraction. All definitions according to Doulatov et al., 2010. HSC, hematopoietic stem cell; MPP, multipotent progenitor; B/NK, committed B/NK precursor; CMP, common myeloid progenitor; MEP megakaryocyte/erythroid progenitor. In this analysis, it was not possible to separate Flt-3+ CMP from Flt-3− MEP because Flt3 was not expressed by the subjects’ CD34+ cells; thus, CMP and MEP were combined.
Figure 5.
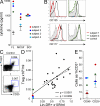
Elevation of Flt3L with T reg cell deficiency. (A) Serum Flt3L, M-CSF, and SCF concentrations measured by ELISA. Each subject was analyzed once. (B) Expression of Flt-3/CD135 and SCF-R/CD117 on BM CD34+ cells of subjects 1 and 3 compared with healthy controls and isotype (filled histogram). Each subject was analyzed twice. (C) Representative example of T reg cell analysis from subject versus normal control. Number indicates absolute count ×106 /ml. (D) Absolute number of CD4+CD25hiFoxP3+ T reg cells compared with HLA-DR+ lineage− (CD3, 19, 20, 56) cells in subjects 1–4, as indicated, and controls (n = 21). Each subject was analyzed once. (E) Proportion of CD56+ and CD25+ CD3+ T cells in subjects 1–4 as indicated relative to controls.
Similar articles
- Absolute values of dendritic cell subsets in bone marrow, cord blood, and peripheral blood enumerated by a novel method.
Szabolcs P, Park KD, Reese M, Marti L, Broadwater G, Kurtzberg J. Szabolcs P, et al. Stem Cells. 2003;21(3):296-303. doi: 10.1634/stemcells.21-3-296. Stem Cells. 2003. PMID: 12743324 - Effect of CXC chemokine platelet factor 4 on differentiation and function of monocyte-derived dendritic cells.
Xia CQ, Kao KJ. Xia CQ, et al. Int Immunol. 2003 Aug;15(8):1007-15. doi: 10.1093/intimm/dxg100. Int Immunol. 2003. PMID: 12882838 - 1-alpha,25-Dihydroxyvitamin D3 (1,25(OH)(2)D(3)) hampers the maturation of fully active immature dendritic cells from monocytes.
Canning MO, Grotenhuis K, de Wit H, Ruwhof C, Drexhage HA. Canning MO, et al. Eur J Endocrinol. 2001 Sep;145(3):351-7. doi: 10.1530/eje.0.1450351. Eur J Endocrinol. 2001. PMID: 11517017 - Costimulatory function of umbilical cord blood CD14+ and CD34+ derived dendritic cells.
Dilioglou S, Cruse JM, Lewis RE. Dilioglou S, et al. Exp Mol Pathol. 2003 Aug;75(1):18-33. doi: 10.1016/s0014-4800(03)00034-0. Exp Mol Pathol. 2003. PMID: 12834622 - Rapid flow cytometric identification of putative CD14- and CD64- dendritic cells in whole blood.
Macey MG, McCarthy DA, Vogiatzi D, Brown KA, Newland AC. Macey MG, et al. Cytometry. 1998 Mar 1;31(3):199-207. doi: 10.1002/(sici)1097-0320(19980301)31:3<199::aid-cyto7>3.0.co;2-g. Cytometry. 1998. PMID: 9515719
Cited by
- BAFF-associated granulomatous lung disease in a patient with GATA2 deficiency.
Yasutomi-Sakai M, Hayashi T, Suzuki K, Akeda H, Maeda Y, Okada A, Takeda T, Watanabe Y, Imamura Y, Ohshima Y. Yasutomi-Sakai M, et al. J Allergy Clin Immunol Glob. 2024 Aug 28;3(4):100336. doi: 10.1016/j.jacig.2024.100336. eCollection 2024 Nov. J Allergy Clin Immunol Glob. 2024. PMID: 39328578 Free PMC article. - Malignant progression of preleukemic disorders.
Hall T, Gurbuxani S, Crispino JD. Hall T, et al. Blood. 2024 May 30;143(22):2245-2255. doi: 10.1182/blood.2023020817. Blood. 2024. PMID: 38498034 Review. - FLT3L-dependent dendritic cells control tumor immunity by modulating Treg and NK cell homeostasis.
Régnier P, Vetillard M, Bansard A, Pierre E, Li X, Cagnard N, Gautier EL, Guermonprez P, Manoury B, Podsypanina K, Darrasse-Jèze G. Régnier P, et al. Cell Rep Med. 2023 Dec 19;4(12):101256. doi: 10.1016/j.xcrm.2023.101256. Cell Rep Med. 2023. PMID: 38118422 Free PMC article. - Monogenic etiologies of persistent human papillomavirus infections: A comprehensive systematic review.
Biglari S, Moghaddam AS, Tabatabaiefar MA, Sherkat R, Youssefian L, Saeidian AH, Vahidnezhad F, Tsoi LC, Gudjonsson JE, Hakonarson H, Casanova JL, Béziat V, Jouanguy E, Vahidnezhad H. Biglari S, et al. Genet Med. 2024 Feb;26(2):101028. doi: 10.1016/j.gim.2023.101028. Epub 2023 Nov 14. Genet Med. 2024. PMID: 37978863 Review. - Role of the pioneer transcription factor GATA2 in health and disease.
Aktar A, Heit B. Aktar A, et al. J Mol Med (Berl). 2023 Oct;101(10):1191-1208. doi: 10.1007/s00109-023-02359-8. Epub 2023 Aug 25. J Mol Med (Berl). 2023. PMID: 37624387 Review.
References
- Angel C.E., George E., Brooks A.E., Ostrovsky L.L., Brown T.L., Dunbar P.R. 2006. Cutting edge: CD1a+ antigen-presenting cells in human dermis respond rapidly to CCR7 ligands. J. Immunol. 176:5730–5734 - PubMed
- Birnberg T., Bar-On L., Sapoznikov A., Caton M.L., Cervantes-Barragán L., Makia D., Krauthgamer R., Brenner O., Ludewig B., Brockschnieder D., et al. 2008. Lack of conventional dendritic cells is compatible with normal development and T cell homeostasis, but causes myeloid proliferative syndrome. Immunity. 29:986–997 10.1016/j.immuni.2008.10.012 - DOI - PubMed
Publication types
MeSH terms
Substances
Grants and funding
- WT_/Wellcome Trust/United Kingdom
- BB/E012841/1/BB_/Biotechnology and Biological Sciences Research Council/United Kingdom
- G0701897/MRC_/Medical Research Council/United Kingdom
- G0800358/MRC_/Medical Research Council/United Kingdom
LinkOut - more resources
Full Text Sources
Other Literature Sources
Research Materials
Miscellaneous


