The soluble form of Bax regulates mitochondrial fusion via MFN2 homotypic complexes - PubMed (original) (raw)
The soluble form of Bax regulates mitochondrial fusion via MFN2 homotypic complexes
Suzanne Hoppins et al. Mol Cell. 2011.
Abstract
In mammals, fusion of the mitochondrial outer membrane is controlled by two DRPs, MFN1 and MFN2, that function in place of a single outer membrane DRP, Fzo1 in yeast. We addressed the significance of two mammalian outer membrane fusion DRPs using an in vitro mammalian mitochondrial fusion assay. We demonstrate that heterotypic MFN1-MFN2 trans complexes possess greater efficacy in fusion as compared to homotypic MFN1 or MFN2 complexes. In addition, we show that the soluble form of the proapoptotic Bcl2 protein, Bax, positively regulates mitochondrial fusion exclusively through homotypic MFN2 trans complexes. Together, these data demonstrate functional and regulatory distinctions between MFN1 and MFN2 and provide insight into their unique physiological roles.
Copyright © 2011 Elsevier Inc. All rights reserved.
Figures
Figure 1. Mammalian mitochondrial outer and inner fusion in vitro
(A) Schematic representation of content mixing in vitro fusion assay (top) and fluorescent images of a fusion reaction with wild type m-GFP and m-dsRed mitochondria in the absence of exogenous energy (bottom, left) and with the addition of an energy regeneration system and nucleotides (bottom, right). Fusion events are indicated with arrows. (B) Energetic requirements of mitochondrial fusion in vitro. Fusion efficiency is described as a percentage of the standard reaction which contains an energy regeneration system, ATP and GTP and was performed in parallel. Error bars show mean + standard error of at least three experiments and statistical significance was determine by paired t-test analysis *P<0.05 ** P=0.002 *** P=0.0002 **** P<0.0001. (C) Western blot analysis of mitochondrial proteins during in vitro fusion reactions. Mitochondrial fusion reactions without (standard) or with valinomycin 1 mM (val), 1 mM nigericin (nig) or 100 μM carbonyl cyanide m-chlorophenylhydrazone (CCCP) were stopped at the indicated times and proteins were subject to SDS-PAGE and Western analysis with the indicated antibodies. (D) Electron micrograph images of a fusion reaction with wild type mitochondria in the absence of exogenous energy. Representative images of outer membrane fusion events are shown. Scale bar represents 5μm. (E) Energetic requirements of mitochondrial outer membrane fusion in vitro. Outer membrane fusion efficiency for each condition is described as a percentage of the standard reaction performed in parallel. Error bars show mean + standard error of at least two independent experiments and statistical significance * (P=0.0012) was determined by One way Anova analysis.
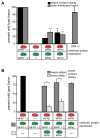
Figure 2. Analysis of the role of MFN1, MFN2 and OPA1 in mitochondrial fusion
(A) Mitochondria were isolated from wild type, Mfn1-/-Mfn2+/+, Mfn1+/+Mfn2-/-, Mfn1-/-Mfn2-/- or OPA1-/- cells and subjected to either S2 fusion conditions (black bars) or S1 fusion conditions (grey bars) to assess mitochondrial inner and outer versus mitochondrial outer membrane fusion efficiency, respectively. Data are expressed as a percent of the wild type control reactions performed in parallel and statistical significance was determined by paired t-test analysis. *P=0.0002 **P=0.0017 ***P=0.0095 (B) Mitochondria isolated from the indicated cell lines were subjected to S2 fusion conditions in hetero-allelic reactions (grey bars) to assess the requirement for each protein on mitochondria fusion partners. For comparison, results are shown with data from homotypic fusion experiments performed in parallel from (A) (light grey bars) and wild type control (black bar). For both, error bars show mean + standard error of at least three independent experiments and Paired t-test analysis was performed to determine statistical significance *P=0.0049.
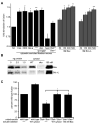
Figure 3. Bax regulates mammalian mitochondrial fusion in vitro
(A) Mitochondria were isolated from wild type cells and subjected to S2 fusion conditions in the presence of the indicated cytosolic enriched fraction (black bars) or the indicated concentration of recombinant purified Bax or Bcl-xL (grey bars). Error bars show mean + standard error of at least three independent experiments and Paired t-test analysis was performed to determine statistical significance *P≤0.05 **P≤0.004 ***P=0.008 (B) The indicated amounts of purified recombinant Bax (top) and Bcl-xL (bottom) and the equivalent amount of either cytosolic-enriched extract (wild type or Bak-/-Bax-/-) or recombinant purified Bax or Bcl-xL added to one fusion reaction were subject to SDS-PAGE and Western analysis with the indicated antibody. Some lanes of the same exposure from the same blots were rearranged to generate the figure. (C) Mitochondria isolated from either wild type or Bak-/-Bax-/- cells were subjected to S2 fusion conditions under standard conditions or with the addition of either wild type MEF cytosolic enriched fraction or 150 nM purified recombinant Bax. After 60 minutes, the fusion reactions were stopped, fusion was quantified and is expressed as a fold induction of each standard reaction, performed in parallel. Error bars show mean + standard error of at least three independent experiments and Paired t-test analysis was performed to determine statistical significance *P≤0.05
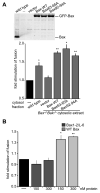
Figure 4. Soluble Bax stimulates mitochondrial fusion in vitro
(A) Cytosolic enriched fractions prepared from wild type, Bak-/-Bax-/- cells or Bak-/-Bax-/- cells expressing the indicated GFP-Bax variant were separated by SDS-PAGE and subject to Western analysis with Bax-specific antibody (top panel). Mitochondria were isolated from Bak-/-Bax-/- cells and subjected to standard S2 fusion conditions in the absence (black bar) or presence of wild type MEF cytosolic enriched fraction or cytosolic enriched fractions from Bak-/-Bax-/- cells expressing the indicated GFP-Bax variant (light grey bars). Error bars show mean + standard error of at least three independent experiments and Paired t-test analysis was performed to determine statistical significance *P=0.04 **P≤0.025 (B) Mitochondria isolated from wild type MEFs were subject to S2 fusion conditions in the presence of the indicated amount of recombinant purified Bax1-2/L-6 or wild type Bax. After 60 minutes, the fusion reactions were stopped, fusion was quantified and is expressed as a fold induction of each standard reaction, all performed in parallel. Error bars show mean + standard error of at least three independent experiments and Paired t-test analysis was performed to determine statistical significance *P=0.05 **P=0.003.
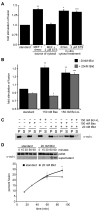
Figure 5. Apoptotic active Bax cannot stimulate mitochondrial fusion
(A) Mitochondria were isolated from wild type cells and subjected to S2 fusion conditions in the presence of cytosolic enriched fractions collected from wild type MEFs treated with DMSO or 2 μM STS for 4 hours (left) or wild type MEF cytosolic enriched fraction containing either DMSO or 2 μM STS (right). Error bars show mean + standard error of at least three independent experiments and Paired t-test analysis was performed to determine statistical significance *P=0.017 **P=0.008 ***P=0.005 (B) Mitochondria were isolated from wild type cells and subjected to S2 fusion conditions (standard) in the presence of either 150 nM recombinant purified Bax or Bcl-xL in the presence (grey bars) or absence (black bars) of 20 nM recombinant purified tBid. After 60 minutes, fusion was quantified and expressed as a fold induction of each standard reaction performed in parallel. Error bars show mean + standard error of at least three independent experiments and Paired t-test analysis was performed to determine statistical significance *P=0.01 **P=0.03 ***P=0.007. (C) Samples from (B) were split and analyzed for MOMP by monitoring cytochrome c release from the mitochondrial fraction (P) to the supernatant fraction (S) by Western analysis. (D) Mitochondria were isolated from wild type cells and subjected to S2 fusion conditions in the absence (standard) and presence of 20 nM tBid. Samples were split and analyzed for either MOMP (top panel, as in C) or fusion (bottom panel). Error bars show mean + standard error of at least three independent experiments and Paired t-test analysis was performed to determine statistical significance *P=0.0086.
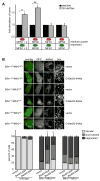
Figure 6. Bax positively regulates MFN2 homotypic fusion activity in vitro and in cells
(A) Mitochondria were isolated from the indicated cell lines and subjected to S2 in vitro fusion conditions in the absence (black bars) or presence (grey bars) of 150 nM recombinant purified Bax. After 60 minutes, the fusion reactions were stopped, fusion was quantified and is expressed as a fold induction of each standard reaction, performed in parallel (ie absence of Bax). Error bars show mean + standard error of at least three independent experiments and Paired t-test analysis was performed to determine statistical significance *P=0.03 **P=0.02. (B) Representative images of the indicated cell lines expressing empty vector (vector) or GFP-Bax92-94Ala (upper panel). Scale bar is 10 μm. Quantification of mitochondrial morphology of GFP-positive cells expressing the GFP-Bax variants shown (lower panel). Error bars show mean + standard error of at least three experiments and Paired t-test analysis was performed to determine statistical significance *P=0.04 **P=0.01.
Comment in
- Mitochondrial fusion: bax to the fussure.
Martin SJ. Martin SJ. Dev Cell. 2011 Feb 15;20(2):142-3. doi: 10.1016/j.devcel.2011.01.016. Dev Cell. 2011. PMID: 21316581
Similar articles
- Mitofusins Mfn1 and Mfn2 coordinately regulate mitochondrial fusion and are essential for embryonic development.
Chen H, Detmer SA, Ewald AJ, Griffin EE, Fraser SE, Chan DC. Chen H, et al. J Cell Biol. 2003 Jan 20;160(2):189-200. doi: 10.1083/jcb.200211046. Epub 2003 Jan 13. J Cell Biol. 2003. PMID: 12527753 Free PMC article. - A catalytic domain variant of mitofusin requiring a wildtype paralog for function uncouples mitochondrial outer-membrane tethering and fusion.
Engelhart EA, Hoppins S. Engelhart EA, et al. J Biol Chem. 2019 May 17;294(20):8001-8014. doi: 10.1074/jbc.RA118.006347. Epub 2019 Apr 1. J Biol Chem. 2019. PMID: 30936207 Free PMC article. - Appoptosin interacts with mitochondrial outer-membrane fusion proteins and regulates mitochondrial morphology.
Zhang C, Shi Z, Zhang L, Zhou Z, Zheng X, Liu G, Bu G, Fraser PE, Xu H, Zhang YW. Zhang C, et al. J Cell Sci. 2016 Mar 1;129(5):994-1002. doi: 10.1242/jcs.176792. Epub 2016 Jan 26. J Cell Sci. 2016. PMID: 26813789 Free PMC article. - Molecular mechanism of mitochondrial membrane fusion.
Griffin EE, Detmer SA, Chan DC. Griffin EE, et al. Biochim Biophys Acta. 2006 May-Jun;1763(5-6):482-9. doi: 10.1016/j.bbamcr.2006.02.003. Epub 2006 Mar 9. Biochim Biophys Acta. 2006. PMID: 16571363 Review. - Mitochondrial outer-membrane permeabilization and remodelling in apoptosis.
Jourdain A, Martinou JC. Jourdain A, et al. Int J Biochem Cell Biol. 2009 Oct;41(10):1884-9. doi: 10.1016/j.biocel.2009.05.001. Epub 2009 May 9. Int J Biochem Cell Biol. 2009. PMID: 19439192 Review.
Cited by
- Inhibition of mitochondrial fusion is an early and critical event in breast cancer cell apoptosis by dietary chemopreventative benzyl isothiocyanate.
Sehrawat A, Croix CS, Baty CJ, Watkins S, Tailor D, Singh RP, Singh SV. Sehrawat A, et al. Mitochondrion. 2016 Sep;30:67-77. doi: 10.1016/j.mito.2016.06.006. Epub 2016 Jun 30. Mitochondrion. 2016. PMID: 27374852 Free PMC article. - Mitochondrial dynamics in the adult cardiomyocytes: which roles for a highly specialized cell?
Piquereau J, Caffin F, Novotova M, Lemaire C, Veksler V, Garnier A, Ventura-Clapier R, Joubert F. Piquereau J, et al. Front Physiol. 2013 May 10;4:102. doi: 10.3389/fphys.2013.00102. eCollection 2013. Front Physiol. 2013. PMID: 23675354 Free PMC article. - Mitochondria: in sickness and in health.
Nunnari J, Suomalainen A. Nunnari J, et al. Cell. 2012 Mar 16;148(6):1145-59. doi: 10.1016/j.cell.2012.02.035. Cell. 2012. PMID: 22424226 Free PMC article. Review. - The intracellular redox state is a core determinant of mitochondrial fusion.
Shutt T, Geoffrion M, Milne R, McBride HM. Shutt T, et al. EMBO Rep. 2012 Oct;13(10):909-15. doi: 10.1038/embor.2012.128. Epub 2012 Sep 4. EMBO Rep. 2012. PMID: 22945481 Free PMC article. - Two distinct actin filament populations have effects on mitochondria, with differences in stimuli and assembly factors.
Fung TS, Ji WK, Higgs HN, Chakrabarti R. Fung TS, et al. J Cell Sci. 2019 Sep 23;132(18):jcs234435. doi: 10.1242/jcs.234435. J Cell Sci. 2019. PMID: 31413070 Free PMC article.
References
- Amati-Bonneau P, Milea D, Bonneau D, Chevrollier A, Ferre M, Guillet V, Gueguen N, Loiseau D, de Crescenzo MA, Verny C, et al. OPA1-associated disorders: phenotypes and pathophysiology. Int J Biochem Cell Biol. 2009;41:1855–1865. - PubMed
- Cartoni R, Martinou JC. Role of mitofusin 2 mutations in the physiopathology of Charcot-Marie-Tooth disease type 2A. Exp Neurol. 2009;218:268–273. - PubMed
- Cerveny KL, Tamura Y, Zhang Z, Jensen RE, Sesaki H. Regulation of mitochondrial fusion and division. Trends Cell Biol. 2007;17:563–569. - PubMed
Publication types
MeSH terms
Substances
LinkOut - more resources
Full Text Sources
Other Literature Sources
Research Materials
Miscellaneous

