Human thrombopoietin knockin mice efficiently support human hematopoiesis in vivo - PubMed (original) (raw)
. 2011 Feb 8;108(6):2378-83.
doi: 10.1073/pnas.1019524108. Epub 2011 Jan 24.
Tim Willinger, Hitoshi Takizawa, Chozhavendan Rathinam, Wojtek Auerbach, Andrew J Murphy, David M Valenzuela, George D Yancopoulos, Elizabeth E Eynon, Sean Stevens, Markus G Manz, Richard A Flavell
Affiliations
- PMID: 21262827
- PMCID: PMC3038726
- DOI: 10.1073/pnas.1019524108
Human thrombopoietin knockin mice efficiently support human hematopoiesis in vivo
Anthony Rongvaux et al. Proc Natl Acad Sci U S A. 2011.
Abstract
Hematopoietic stem cells (HSCs) both self-renew and give rise to all blood cells for the lifetime of an individual. Xenogeneic mouse models are broadly used to study human hematopoietic stem and progenitor cell biology in vivo. However, maintenance, differentiation, and function of human hematopoietic cells are suboptimal in these hosts. Thrombopoietin (TPO) has been demonstrated as a crucial cytokine supporting maintenance and self-renewal of HSCs. We generated RAG2(-/-)γ(c)(-/-) mice in which we replaced the gene encoding mouse TPO by its human homolog. Homozygous humanization of TPO led to increased levels of human engraftment in the bone marrow of the hosts, and multilineage differentiation of hematopoietic cells was improved, with an increased ratio of myelomonocytic verus lymphoid lineages. Moreover, maintenance of human stem and progenitor cells was improved, as demonstrated by serial transplantation. Therefore, RAG2(-/-)γ(c)(-/-) TPO-humanized mice represent a useful model to study human hematopoiesis in vivo.
Conflict of interest statement
The authors declare no conflict of interest.
Figures
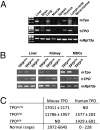
Fig. 1.
Faithful tissue-specific expression of human TPO in knock-in mice. (A) RT-PCR analysis of mouse TPO (m_Tpo_) and human TPO (h_TPO_) expression in different tissues of a Rag2+/−γcY/− TPOh/m mouse. Mouse Rpl13a was used as housekeeping gene. (B) RT-PCR analysis of m_Tpo_ and h_TPO_ expression in liver, kidney, and mesenchymal multipotent stromal cells (MSCs) of Rag2−/−γc−/− TPOm/m, TPOh/m, and TPOh/h mice. (C) Concentrations of mouse and human TPO proteins measured by ELISA in serum of TPOm/m, TPOh/m, and TPOh/h mice (in pg/mL, mean ± SD, n = 7–9). ND, not detected. The normal ranges indicated are from R&D Systems, Thrombopoietin Quantikine kits.
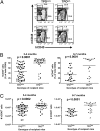
Fig. 2.
Improved human engraftment levels in bone marrow of TPOh/h recipient mice. (A) Representative FACS analysis of human and mouse CD45+ cells in bone marrow of TPOm/m and TPOh/h mice 3–4 mo after engraftment. Percentages of mouse and human CD45+ cells among the total CD45+ cell populations are indicated. (B) Percentages of human CD45+ cells in the bone marrow 3–4 mo (Left; n = 42–53) or 6–7 mo (Right; n = 20–25) after transplantation. Each symbol represents an individual mouse; horizontal bars indicate mean values. (C) Absolute numbers of human CD45+ cells in the bone marrow of the same animals as in B.
Fig. 3.
Effect of TPO humanization on mouse and human platelets. (A) Platelet counts in the blood of adult nonengrafted mice. P < 0.0001 (one-way ANOVA, _n_ = 7–17; _P_ values calculated with the Tukey post hoc test). (_B_) Representative FACS analysis of mouse (mCD61+) and human (hCD41a+) platelets in the blood of TPOm/m and TPOh/h mice 3–4 mo after engraftment. The numbers indicate percentages among total events. (_C_) Human platelet chimerism, determined by FACS, in TPOm/m and TPOh/h mice (_n_ = 19–22). Only mice with a percentage of human CD45+ cells in the blood >5% were included in this analysis. (D and E) Counts of mouse (mCD61+; D) and human (hCD41a+; E) platelets in the blood. (F) Human megakoryocyte percentages (CD41a+) among human CD45+ cells in the bone marrow.
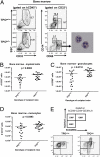
Fig. 4.
Improved multilineage hematopoiesis in human TPO knock-in mice. (A) Representative FACS analysis of human myeloid cell populations in bone marrow. (Right) DiffQuick staining of hCD45+SSChiCD33+CD66hi cells purified from the bone marrow of TPOh/h recipients. (B_–_D) Absolute numbers of human myeloid cell populations in bone marrow (n = 19). (B) Total myeloid populations (CD33+ cells). (C) Granulocytes (CD33+CD66hi). (D) Monocytes (CD33+CD66loCD14+). (E) FACS analysis of the myeloid progenitors population, based on the expression of CD123 and CD45RA, among CD34+ cells isolated from the bone marrow and gated on the Lin−CD38+ population. The plots shown are representative of 3–5 mice per group.
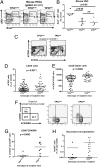
Fig. 5.
Decreased mouse lin−c-Kit+Sca1+ cells and increased number and self-renewal potential of human stem and progenitor cells in bone marrow of human TPO knock-in mice. (A) Representative FACS analysis of mouse Lin− Sca1+ c-Kit+ stem and progenitor cells in the bone marrow of nonengrafted mice. Numbers indicate the percentage of Sca1+ c-Kit+ cells among the Lin− population. (B) Quantitative analysis of the results presented in A. P = 0.0006 (one-way ANOVA; P values calculated with the Tukey post hoc test; n = 5 per genotype; representative of two independent experiments). (C) Representative FACS analysis of human CD34+CD38− cells in the bone marrow. The numbers indicate the percentage of CD38− cells among the human CD45+CD34+ cells. (D) Quantitative analysis of the percentages of CD38− cells in the human CD45+CD34+ population (n = 43–53). (E) Absolute numbers of human CD34+CD38− cells in the bone marrow of the same mice as in D. (F) Representative FACS analysis of the hematopoietic stem and progenitor cells, based on the expression of CD90 and CD45RA, among CD34+ cells isolated from the bone marrow and gated on the Lin−CD38− population. LT-HSC, long-term hematopoietic stem cells; MPP, multipotent progenitors; MLP, multilymphoid progenitors. (G) Quantitative analysis of the percentages of Lin−CD34+CD38−CD90+CD45RA− cells, as identified in F. n = 6–8, from two experiments with 4- to 5-mo-old mice. (H) Human CD45+CD34+ cells were purified from Rag2−/−γc−/− TPOm/m and TPOh/h primary recipient mice, transplanted into newborn Rag2−/−γc−/− mice (100,000 cells per mouse), and human CD45+ chimerism was determined in secondary recipients 8 wk later. The results are pooled from two independent experiments (n = 7–12 primary recipients, n = 11–19 secondary recipients).
Similar articles
- Thrombopoietin expands hematopoietic stem cells after transplantation.
Fox N, Priestley G, Papayannopoulou T, Kaushansky K. Fox N, et al. J Clin Invest. 2002 Aug;110(3):389-94. doi: 10.1172/JCI15430. J Clin Invest. 2002. PMID: 12163458 Free PMC article. - Transgenic expression of human signal regulatory protein alpha in Rag2-/-gamma(c)-/- mice improves engraftment of human hematopoietic cells in humanized mice.
Strowig T, Rongvaux A, Rathinam C, Takizawa H, Borsotti C, Philbrick W, Eynon EE, Manz MG, Flavell RA. Strowig T, et al. Proc Natl Acad Sci U S A. 2011 Aug 9;108(32):13218-23. doi: 10.1073/pnas.1109769108. Epub 2011 Jul 25. Proc Natl Acad Sci U S A. 2011. PMID: 21788509 Free PMC article. - Quantitative assessment of the stem cell self-renewal capacity.
Nakauchi H, Sudo K, Ema H. Nakauchi H, et al. Ann N Y Acad Sci. 2001 Jun;938:18-24; discussion 24-5. doi: 10.1111/j.1749-6632.2001.tb03570.x. Ann N Y Acad Sci. 2001. PMID: 11458506 Review. - Developmental biology of thrombopoietin in the human fetus and neonate.
Dame C. Dame C. Acta Paediatr Suppl. 2002;91(438):54-65. doi: 10.1111/j.1651-2227.2002.tb02900.x. Acta Paediatr Suppl. 2002. PMID: 12477265 Review.
Cited by
- New generation humanized mice for virus research: comparative aspects and future prospects.
Akkina R. Akkina R. Virology. 2013 Jan 5;435(1):14-28. doi: 10.1016/j.virol.2012.10.007. Virology. 2013. PMID: 23217612 Free PMC article. Review. - Development of a new humanized mouse model to study acute inflammatory arthritis.
Misharin AV, Haines GK 3rd, Rose S, Gierut AK, Hotchkiss RS, Perlman H. Misharin AV, et al. J Transl Med. 2012 Sep 13;10:190. doi: 10.1186/1479-5876-10-190. J Transl Med. 2012. PMID: 22974474 Free PMC article. - HIV-1 immunopathogenesis in humanized mouse models.
Zhang L, Su L. Zhang L, et al. Cell Mol Immunol. 2012 May;9(3):237-44. doi: 10.1038/cmi.2012.7. Epub 2012 Apr 16. Cell Mol Immunol. 2012. PMID: 22504952 Free PMC article. Review. - Time 2EVOLVE: predicting efficacy of engineered T-cells - how far is the bench from the bedside?
Guedan S, Luu M, Ammar D, Barbao P, Bonini C, Bousso P, Buchholz CJ, Casucci M, De Angelis B, Donnadieu E, Espie D, Greco B, Groen R, Huppa JB, Kantari-Mimoun C, Laugel B, Mantock M, Markman JL, Morris E, Quintarelli C, Rade M, Reiche K, Rodriguez-Garcia A, Rodriguez-Madoz JR, Ruggiero E, Themeli M, Hudecek M, Marchiq I. Guedan S, et al. J Immunother Cancer. 2022 May;10(5):e003487. doi: 10.1136/jitc-2021-003487. J Immunother Cancer. 2022. PMID: 35577501 Free PMC article. Review. - Human-animal interspecies chimerism via blastocyst complementation: advances, challenges and perspectives: a narrative review.
Li Y, Huang K. Li Y, et al. Stem Cell Investig. 2021 Oct 11;8:20. doi: 10.21037/sci-2020-074. eCollection 2021. Stem Cell Investig. 2021. PMID: 34815975 Free PMC article. Review.
References
- Kondo M, et al. Biology of hematopoietic stem cells and progenitors: Implications for clinical application. Annu Rev Immunol. 2003;21:759–806. - PubMed
- Chao MP, Seita J, Weissman IL. Establishment of a normal hematopoietic and leukemia stem cell hierarchy. Cold Spring Harb Symp Quant Biol. 2008;73:439–449. - PubMed
- McCune JM, et al. The SCID-hu mouse: Murine model for the analysis of human hematolymphoid differentiation and function. Science. 1988;241:1632–1639. - PubMed
- Namikawa R, Kaneshima H, Lieberman M, Weissman IL, McCune JM. Infection of the SCID-hu mouse by HIV-1. Science. 1988;242:1684–1686. - PubMed
Publication types
MeSH terms
Substances
LinkOut - more resources
Full Text Sources
Other Literature Sources
Molecular Biology Databases
Research Materials


