A kinetic aggregation assay allowing selective and sensitive amyloid-β quantification in cells and tissues - PubMed (original) (raw)
. 2011 Mar 15;50(10):1607-17.
doi: 10.1021/bi1013744. Epub 2011 Jan 26.
Affiliations
- PMID: 21268584
- PMCID: PMC3051019
- DOI: 10.1021/bi1013744
A kinetic aggregation assay allowing selective and sensitive amyloid-β quantification in cells and tissues
Deguo Du et al. Biochemistry. 2011.
Abstract
The process of amyloid-β (Aβ) fibril formation is genetically and pathologically linked to Alzheimer's disease (AD). Thus, a selective and sensitive method for quantifying Aβ fibrils in complex biological samples allows a variety of hypotheses to be tested. Herein, we report the basis for a quantitative in vitro kinetic aggregation assay that detects seeding-competent Aβ aggregates in mammalian cell culture media, in Caenorhabditis elegans lysate, and in mouse brain homogenate. Sonicated, proteinase K-treated Aβ fibril-containing tissue homogenates or cell culture media were added to an initially monomeric Aβ(1-40) reporter peptide to seed an in vitro nucleated aggregation reaction. The reduction in the half-time (t(50)) of the amyloid growth phase is proportional to the quantity of seeding-competent Aβ aggregates present in the biological sample. An ion-exchange resin amyloid isolation strategy from complex biological samples is demonstrated as an alternative for improving the sensitivity and linearity of the kinetic aggregation assay.
Figures
Figure 1
The effect of adding preformed Aβ1–40 or Aβ1–42 fibrils on an Ab1–40 amyloidogenesis reaction—the basis for the Ab1–40 kinetic aggregation assay. (a) Free energy amyloidogenesis reaction coordinate diagram for the nucleation-dependent aggregation of Aβ1–40 (solid line). Addition of a sufficient quantity of preformed Ab1–40 fibrils or seeds (dashed line) eliminates the requirement for nucleation, which is the rate-limiting step for Aβ1–40 amyloidogenesis. Inset: A typical nucleated polymerization time course. The addition of amyloid fibril seeds reduces the t50 proportional to the quantity of seed termini added. (b) Aβ1–40 (10 μM) aggregation kinetics (pH 7.4, 37 °C) with agitation (5s of shaking every 10 min) in the absence or presence of the indicated amount of preformed Aβ1–40 amyloid seeds (sonicated for 40 min before addition). The amyloidogenesis reaction is followed by the binding of ThT to the fibril which dramatically increases its fluorescence quantum yield. Fluorescence is normalized to the value of the plateau phase in a given reaction. (c) The observed amyloidogenesis t50 as a function of the amount of Aβ1–40 amyloid seed added. Data are reported as mean ± SD of triplicate results.
Figure 2
Aβ1–40 kinetic aggregation assay to which wild type mouse brain homogenate (spiked with a known amount of preformed and sonicated Aβ1–40 amyloid fibrils) was added. (a) Aβ1–40 (10 μM) kinetic aggregation traces detected by ThT fluorescence (pH 7.4, 37 °C) with agitation (5s of shaking every 10 min) without and in the presence of known quantities of preformed Aβ1–40 amyloid seeds (0.043–43 ng/mL) added to mouse brain tissue. Fluorescence is normalized to the value of the plateau phase in a given reaction. The mouse brain homogenate without or with added Aβ fibrils was sonicated for 40 min before being added to the kinetic aggregation assay. (b) Comparison of Aβ1–40 amyloidogenesis t50 without (open triangles) or with PK and PI pretreatment (filled diamonds). Data are reported as the mean ± SD of triplicate experiments. A P value of < 0.005 is realized when comparing the mean t50 values in the absence and presence (0.043 ng/mL) of Aβ seeds (indicated with an * in the figure) utilizing the PK and PI treatment protocol (filled diamonds). In contrast, a P value of > 0.8 is observed when the t50 mean values obtained in the absence and in the presence (0.043 ng/mL) of Aβ seeds are compared without PK and PI treatment (unfilled triangles). (c) Aβ1–40 kinetic aggregation traces of proteinase K (PK) treated mouse brain tissue without and in the presence of known quantities of preformed Aβ1–40 amyloid seeds. The mouse homogenate without or with added Aβ fibrils was sonicated for 40 min, treated with PK for 2 h (w/w ratio of PK to total protein in the mouse brain sample is 1:500), inhibited by Roche protease inhibitor cocktail (PI) at four times the recommended concentration, then sonicated for another 20 min before being added to the kinetic aggregation assay. (d) Dilution series of Aβ1–40 amyloid spiked into wild type mouse brain tissue as detected by Western blot analysis using the 6E10 antibody (antigen retrieval procedures not employed).
Figure 3
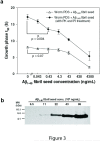
Aβ1–40 kinetic aggregation assay utilizing wild type C. elegans worm PDS with known quantities of preformed Aβ1–40 amyloid fibrils added as seeds. (a) Amyloidogenesis t50 of an Aβ1–40 kinetic aggregation assay without or with the addition of known quantities of Aβ fibrils added to worm PDS. The assay was performed as described in Figure 2. Triplicate data are reported as mean ± SD. A P value of < 0.004 is observed when comparing the mean t50 values in the absence and presence (0.43 ng/mL) of Aβ seeds (indicated with an * in the figure) utilizing the PK and PI treatment protocol (filled triangles). In contrast, a P value > 0.07 between the mean t50 values in the absence and the presence (0.43 ng/mL) of Aβ seeds is observed without PK and PI treatment (unfilled triangles). (b) Dilution series of Aβ1–40 amyloid spiked into worm PDS as detected by Western blot analysis using the 6E10 antibody (antigen retrieval procedures not employed).
Figure 4
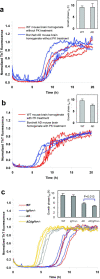
Aβ1–40 kinetic aggregation traces with added mouse brain homogenate. Triplicate results are shown in each figure. (a) Wild type (WT) or AD mouse brain homogenate without PK treatment. Inset: t50 of the kinetic aggregation traces. Data are reported as mean ± SD of triplicate results. (b) WT or AD mouse brain homogenate with PK and PI treatment. Inset: t50 of the kinetic aggregation traces with data reported as mean ± SD of triplicate results. (c) WT, Igf1r+/−, AD and AD;Igf1r+/− mouse brain homogenates with PK and thermal denaturation treatment. The mouse brain homogenates were sonicated for 40 min, treated with PK for 2 h, then boiled for 10 min, sonicated for an additional 20 min, and added to the Aβ1–40 kinetic aggregation assay. Inset: t50 of the kinetic aggregation traces with data reported as mean ± SD. p < 0.013 between AD and AD;Igf1r+/− (analyzed using a two-tailed student's t-test).
Figure 5
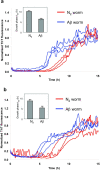
Aβ1–40 kinetic aggregation assay with added wild type (N2) or Aβ worm PDS with PK and PI pretreatment (a) or without PK and PI pretreatment (b). Triplicate results are shown in each figure. The assay was performed as described in Figure 2 except that the worm samples were sonicated for only 20 min before PK treatment. Insets: statistical analysis of results obtained in (a) (p < 0.005) and in (b) (p < 0.013), with data reported as mean ± SD.
Figure 6
Aβ1–40 kinetic aggregation traces with added conditioned cell media after PK and PI pretreatment, results shown in triplicate. Cells were treated with tetracycline for 4 days to induce APP expression. Tetracycline-treated EV cells do not over express APP; whereas APPwt cells overexpress wild type APP; APPswe cells overexpress APPswe and Aβ. The assay was performed as described for the worm samples. Inset: Statistical analysis of results reported as mean ± SD. p > 0.09 between EV and APPwt cells; p < 0.002 between EV and APPswe cells.
Figure 7
Ion exchange resin amyloid isolation approach to the Aβ1–40 kinetic aggregation assay. (a) CM cation exchange beads were incubated at 4 °C with shaking overnight without (red curve) or with (blue curve) Aβ1–40 amyloid seeds (13 ng), and then washed with H2O before being added to the Aβ1–40 kinetic aggregation assay. (b) Comparison (t50) of the Aβ1–40 sonicated fibrils added directly to the Aβ1–40 readout peptide (gray bar) vs. sonicated fibrils pre-incubated with CM beads and washed before being added to the Aβ1–40 readout peptide (green bar). Data are reported as the mean ± SD of triplicate experiments. (c) A comparison of the Aβ1–40 (10 μM) amyloidogenesis t50 using the CM resin amyloid isolation strategy vs. mouse brain homogenate doped with known fibril concentrations (sonication but no PK treatment). Data are reported as mean ± SD of triplicate results. CM beads (8 μL) were incubated with mouse brain homogenates doped with known quantities of Ab amyloid seeds at 4 °C with shaking overnight, then washed and added to the Aβ1–40 kinetic aggregation assay. A P value < 0.005 is realized when comparing the mean t50 values in the absence and presence (0.43 ng/mL) of Aμ seeds (indicated with a * in the figure) utilizing the CM ion exchange bead protocol (filled diamonds). In contrast, a P value of > 0.9 is observed when the t50 values obtained in the absence and in the presence (0.43 ng/mL) of Aβ seeds are compared without utilizing the CM bead approach (unfilled triangles, no PK treatment). (d) Differentiating WT mouse brain (red curves) from AD mouse brain (blue curves) using the CM bead amyloid isolation approach (triplicate results are reported). Before adding CM beads to the readout peptide in the kinetic aggregation assay, the beads were loaded with amyloid (if present) by incubating at 4 °C with WT or AD mouse brain homogenate (total protein concentration was 50 μg/mL) with shaking overnight, followed by a washing protocol. Inset: t50 of the growth phases reported as mean ± SD. A P value of < 0.002 is noted between WT and AD (indicated with a * in the figure).
Similar articles
- A Cationic Gallium Phthalocyanine Inhibits Amyloid β Peptide Fibril Formation.
Tabassum S, Sheikh AM, Yano S, Ikeue T, Mitaki S, Michikawa M, Nagai A. Tabassum S, et al. Curr Alzheimer Res. 2020;17(7):589-600. doi: 10.2174/1567205017666201008112002. Curr Alzheimer Res. 2020. PMID: 33032510 - Cell model for the identification and characterization of prion-like components from Alzheimer brain tissue.
Markx D, Loos C, Claus S, Haupt C, Mawrin C, Fändrich M. Markx D, et al. Biochem Biophys Res Commun. 2018 Mar 11;497(3):857-862. doi: 10.1016/j.bbrc.2018.02.137. Epub 2018 Feb 16. Biochem Biophys Res Commun. 2018. PMID: 29458025 - Inhibitory Activity of Insulin on Aβ Aggregation Is Restricted Due to Binding Selectivity and Specificity to Polymorphic Aβ States.
Baram M, Miller Y. Baram M, et al. ACS Chem Neurosci. 2020 Feb 5;11(3):445-452. doi: 10.1021/acschemneuro.9b00645. Epub 2020 Jan 10. ACS Chem Neurosci. 2020. PMID: 31899862 Free PMC article. - In vitro oligomerization and fibrillogenesis of amyloid-beta peptides.
Benseny-Cases N, Klementieva O, Cladera J. Benseny-Cases N, et al. Subcell Biochem. 2012;65:53-74. doi: 10.1007/978-94-007-5416-4_3. Subcell Biochem. 2012. PMID: 23224999 Review. - Biochemical detection of Abeta isoforms: implications for pathogenesis, diagnosis, and treatment of Alzheimer's disease.
Golde TE, Eckman CB, Younkin SG. Golde TE, et al. Biochim Biophys Acta. 2000 Jul 26;1502(1):172-87. doi: 10.1016/s0925-4439(00)00043-0. Biochim Biophys Acta. 2000. PMID: 10899442 Review.
Cited by
- Toward the molecular mechanism(s) by which EGCG treatment remodels mature amyloid fibrils.
Palhano FL, Lee J, Grimster NP, Kelly JW. Palhano FL, et al. J Am Chem Soc. 2013 May 22;135(20):7503-10. doi: 10.1021/ja3115696. Epub 2013 May 7. J Am Chem Soc. 2013. PMID: 23611538 Free PMC article. - Prions: Beyond a Single Protein.
Das AS, Zou WQ. Das AS, et al. Clin Microbiol Rev. 2016 Jul;29(3):633-58. doi: 10.1128/CMR.00046-15. Clin Microbiol Rev. 2016. PMID: 27226089 Free PMC article. Review. - Syntaxin-6 delays prion protein fibril formation and prolongs the presence of toxic aggregation intermediates.
Sangar D, Hill E, Jack K, Batchelor M, Mistry B, Ribes JM, Jackson GS, Mead S, Bieschke J. Sangar D, et al. Elife. 2024 Aug 7;13:e83320. doi: 10.7554/eLife.83320. Elife. 2024. PMID: 39109999 Free PMC article. - Protein misfolding detected early in pathogenesis of transgenic mouse model of Huntington disease using amyloid seeding assay.
Gupta S, Jie S, Colby DW. Gupta S, et al. J Biol Chem. 2012 Mar 23;287(13):9982-9989. doi: 10.1074/jbc.M111.305417. Epub 2011 Dec 20. J Biol Chem. 2012. PMID: 22187438 Free PMC article. - Mucin-Type _O_-Glycosylation Proximal to β-Secretase Cleavage Site Affects APP Processing and Aggregation Fate.
Singh Y, Regmi D, Ormaza D, Ayyalasomayajula R, Vela N, Mundim G, Du D, Minond D, Cudic M. Singh Y, et al. Front Chem. 2022 Apr 8;10:859822. doi: 10.3389/fchem.2022.859822. eCollection 2022. Front Chem. 2022. PMID: 35464218 Free PMC article.
References
- Tanzi RE, Bertram L. Twenty years of the Alzheimer's disease amyloid hypothesis: A genetic perspective. Cell. 2005;120:545–555. - PubMed
- Hardy J, Selkoe DJ. Medicine - The amyloid hypothesis of Alzheimer's disease: Progress and problems on the road to therapeutics. Science. 2002;297:353–356. - PubMed
- Golde TE, Estus S, Younkin LH, Selkoe DJ, Younkin SG. Processing of the amyloid protein precursor to potentially amyloidogenic derivatives. Science. 1992;255:728–730. - PubMed
- Amaducci L, Tesco G. Aging as a major risk for degenerative diseases of the central nervous system. Curr Opin Neurol. 1994;7:283–286. - PubMed
- Cohen E, Bieschke J, Perciavalle RM, Kelly JW, Dillin A. Opposing activities protect against age-onset proteotoxicity. Science. 2006;313:1604–1610. - PubMed
Publication types
MeSH terms
Substances
LinkOut - more resources
Full Text Sources
Other Literature Sources


