Neural dysregulation of peripheral insulin action and blood pressure by brain endoplasmic reticulum stress - PubMed (original) (raw)
Neural dysregulation of peripheral insulin action and blood pressure by brain endoplasmic reticulum stress
Sudarshana Purkayastha et al. Proc Natl Acad Sci U S A. 2011.
Abstract
Chronic endoplasmic reticulum (ER) stress was recently revealed to affect hypothalamic neuroendocrine pathways that regulate feeding and body weight. However, it remains unexplored whether brain ER stress could use a neural route to rapidly cause the peripheral disorders that underlie the development of type 2 diabetes (T2D) and the metabolic syndrome. Using a pharmacologic model that delivered ER stress inducer thapsigargin into the brain, this study demonstrated that a short-term brain ER stress over 3 d was sufficient to induce glucose intolerance, systemic and hepatic insulin resistance, and blood pressure (BP) increase. The collection of these changes was accompanied by elevated sympathetic tone and prevented by sympathetic suppression. Molecular studies revealed that acute induction of metabolic disorders via brain ER stress was abrogated by NF-κB inhibition in the hypothalamus. Therapeutic experiments further revealed that acute inhibition of brain ER stress with tauroursodeoxycholic acid (TUDCA) partially reversed obesity-associated metabolic and blood pressure disorders. In conclusion, ER stress in the brain represents a mediator of the sympathetic disorders that underlie the development of insulin resistance syndrome and T2D.
Conflict of interest statement
The authors declare no conflict of interest.
Figures
Fig. 1.
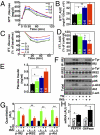
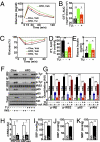
Short-term brain ER stress causes systemic insulin resistance. (A–E) C57BL/6 mice received daily third-ventricle injections of TG at the doses of 0.3, 0.6, or 1.0 μg/d for 3 consecutive d. Vehicle injection was used as negative control and is labeled as 0 in the bar graphs. Mice were fasted overnight before receiving the final injection on day 3 and were examined at 2 h postinjection for GTT (A and B), ITT (C and D), or plasma insulin levels (E). Area under the curve (AUC) data for GTT (B) and ITT (D) were calculated. ITT data are presented as the percentages of time-course blood glucose levels over the baseline level (C) and the percentage changes of AUC over the control (vehicle injection) group (D). *P < 0.05; **P < 0.01; n = 8–9 mice per group. (F–H) Mice injected with TG (1.0 μg/d) or vehicle for 3 consecutive d were anesthetized and challenged with insulin (INS) (5.0 units/kg) or saline for 3 min via the inferior vena cava. Liver samples were rapidly harvested and analyzed for insulin signaling with immunoprecipitation (IP) and Western blots. (G) Tyrosine phosphorylation (p-Tyr) of IRβ and IRS2, the binding of p85 to IRS2, and phosphorylated Akt (p-Akt) were quantitatively normalized by the total protein levels (Total) of IRβ, IRS2, p85, and Akt, respectively. β-actin (β-act) was used as an internal control. (H) Liver tissues were harvested from mice that received 3-d TG vs. vehicle treatment and analyzed for mRNA levels of gluconeogenic enzymes pepck and g6pase with real-time RT-PCR. *P < 0.05; **P < 0.01; n = 4–6 mice per group; AU, arbitrary unit. (Error bars reflect mean ± SEM.)
Fig. 2.
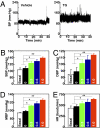
Short-term brain ER stress elevates BP levels in mice. Mice with third-ventricle cannulation were implanted with BP radio transmitter in the carotid artery for continuous telemetric monitoring of BP and heart rates (HR). TG at the doses of 0.3, 0.6, or 1.0 μg/d or control vehicle (labeled as 0 in the bar graphs) was injected for 3 consecutive d. BP and HR of mice were obtained before the 3-d treatment period to obtain the baseline levels (labeled as Basal) and continuously monitored during the 3-d treatment period. (A) Representative profiles of BP in response to 1.0 μg of TG (Right) vs. vehicle (Left) injection. (B–E) Data represent average BP and HR values over a 2-h period after the final injection on day 3. SBP, systolic BP; DBP, diastolic BP; MBP, mean BP. *P < 0.05; **P < 0.01; n = 4 mice per group. (Error bars reflect mean ± SEM.)
Fig. 3.
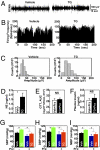
Sympathetic activation in mice with short-term brain ER stress. (A–D) Mice received daily injections of TG (0.3 μg/d) or vehicle for 3 consecutive d. (A–C) At 2 h after the final injection on day 3, animals were anesthetized, and RSNA was recorded (A). n = 3–4 mice per group. The frequency of firing (B) and the spike amplitude (C) were both significantly different between TG- and vehicle-treated groups (P < 0.001). (D) Plasma norepinephrine (NE) concentrations of mice after 3-d TG (1.0 μg) or vehicle treatment. *P < 0.05; n = 7 mice per group. (E and F) C57BL/6 mice received daily third-ventricle injections of TG vs. vehicle (Veh) for 3 consecutive d, and the final injection was provided to overnight-fasted mice in combination with i.p. injection of prazosin (Prz, 1 mg/kg). At 2 h postinjection, mice were subjected to GTT (E) or blood sampling to measure plasma insulin concentrations (F). Data presented for GTT are the AUC values. NS, not significant; n = 8–9 mice per group. (G–I) Mice preimplanted with third-ventricle cannula and artery BP telemetric probes received daily third-ventricle injections of TG vs. vehicle (Veh) for 3 consecutive d, and the final injection was provided in combination with (+) or without (−) i.p. injection of prazosin (Prz, 1 mg/kg). Data represent average BP values over a 2-h period after the final injection. SBP, systolic BP; DBP, diastolic BP; MBP, mean BP. *P < 0.05; n = 4 mice per group. (Error bars reflect mean ± SEM.)
Fig. 4.
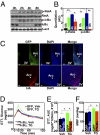
ER stress activates hypothalamic NF-κB to affect peripheral physiology. (A and B) C57BL/6 mice received a single injection of TG (1.0 μg) via preimplanted cannula. Hypothalami were harvested for Western blot analysis of NF-κB signaling at the indicated time points after TG injection. Phosphorylated RelA (p-RelA), phosphorylated IκBα (p-IκBα), and total protein levels of IκBα were measured to reflect NF-κB activities. Vehicle injection was used as the negative control (labeled as 0 h). β-actin (β-act) was used as an internal control. (B) p-RelA and p-IκBα levels were normalized by the total protein levels of RelA and β-actin, respectively. *P < 0.05; **P < 0.01; n = 4–6 mice per group; AU, arbitrary unit. (C) Mice received intra-arcuate injections of adenoviruses expressing either HA-tagged DNIκBα or GFP. At 1 wk postinjection, hypothalamic sections were immunostained for GFP (Upper) and HA (Lower) to verify the site-specific gene delivery. Nuclear staining with DAPI (blue) labels all of the cells in the sections and is merged with GFP (green) or HA (red) staining. Arc, arcuate nucleus; 3V, third ventricle. (Scale bar = 50 μm.) (D and E) Intra-Arc DNIκBα or GFP adenovirus-injected mice received daily injections of TG (1 μg/d) or vehicle (Veh) via third-ventricle cannula for 3 consecutive d. At 2 h after the final injection, mice were examined for GTT. (E) AUC data for GTT. *P < 0.05; n = 6–10 mice per group. (F) DNIκBα or GFP adenovirus-injected mice were implanted with third ventricle cannula and intra arterial telemetric BP probe. BP levels were monitored daily for 3 d before and after TG vs. vehicle injection. Data presented are average mean BP (MBP) values over a 2-h period after the final injection on day 3. *P < 0.05; n = 4 mice per group. (Error bars reflect mean ± SEM.)
Fig. 5.
Acute reversal of obesity-related disorders by inhibiting brain ER stress. Male C57BL/6 mice were maintained on normal chow (Chw) or HFD for 5 mo, since 2 mo of age, and then implanted with third-ventricle cannula. After 2 wk of postoperative recovery, mice received third-ventricle injection of 1.0 μg of TUDCA (TU) or vehicle (Veh) on the night of day 1, followed by overnight fasting and a second injection of TUDCA or vehicle in the morning of day 2. (A–E) Mice at 2 h postinjection on day 2 were separately subjected to GTT (A and B), ITT (C and D), and plasma insulin measurement (E). AUC data of GTT (B) and ITT (D) are presented. ITT data are presented as the percentages of time-course blood glucose over the baseline levels (C) and the percentages of AUC values of treatment groups over the control group (D). *P < 0.05; **P < 0.01; n = 8–9 mice per group. (F and G) Mice at 2 h postinjection on day 2 were anesthetized and challenged with insulin (INS; 5.0 units/kg) or saline for 3 min via abdominal aorta injection. Liver samples were rapidly harvested and analyzed for insulin signaling with immunoprecipitation (IP) and Western blotting. (G) Phosphorylated IRβ (p-IRβ), phosphorylated IRS2 (p-IRS2), binding of p85 to IRS2, and phosphorylated Akt (p-Akt) were quantitatively normalized by the total protein levels (Total) of IRβ, IRS2, p85, and Akt, respectively. β-actin (β-act) was used as an internal control. **P < 0.01; n = 4–6 mice per group; AU, arbitrary unit. (H) Liver tissues were harvested from chow-fed versus HFD-fed mice after 2-d TUDCA or vehicle treatment and analyzed for mRNA levels of pepck and g6pase. *P < 0.05; n = 4–6 mice per group; AU, arbitrary unit. (I–K) Mice were continuously monitored for BP and heart rates (HR) via preimplanted artery BP telemetric probes. Data presented represent average BP values over a 2-h period after TUDCA or vehicle injection on day 2. SBP, systolic BP; DBP, diastolic BP; MBP, mean BP. *P < 0.05; **P < 0.01; n = 4 mice per group. (Error bars reflect mean ± SEM.)
Fig. 6.
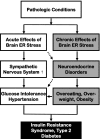
The models of acute versus chronic brain ER stress in obesity/T2D syndrome. Pathological conditions associated with obesity and T2D induce both acute and chronic ER stress in the brain. Acute brain ER stress rapidly up-regulates the sympathetic nervous system activity to cause peripheral insulin resistance, glucose intolerance, and related BP dysregulation. Chronic brain ER stress, on the other hand, disrupts the hypothalamic neuroendocrine functions to cause eating disorder, overweight, and obesity. These neural and neuroendocrine processes are physiologically interconnected and are affecting each other at multiple levels; the combined effects of these two processes represent a significant CNS basis for body weight-independent and body weight-dependent development of T2D and related problems.
Similar articles
- Central administration of an endoplasmic reticulum stress inducer inhibits the anorexigenic effects of leptin and insulin.
Won JC, Jang PG, Namkoong C, Koh EH, Kim SK, Park JY, Lee KU, Kim MS. Won JC, et al. Obesity (Silver Spring). 2009 Oct;17(10):1861-5. doi: 10.1038/oby.2009.194. Epub 2009 Jun 18. Obesity (Silver Spring). 2009. PMID: 19543218 - Endoplasmic reticulum stress promotes LIPIN2-dependent hepatic insulin resistance.
Ryu D, Seo WY, Yoon YS, Kim YN, Kim SS, Kim HJ, Park TS, Choi CS, Koo SH. Ryu D, et al. Diabetes. 2011 Apr;60(4):1072-81. doi: 10.2337/db10-1046. Epub 2011 Feb 25. Diabetes. 2011. PMID: 21357464 Free PMC article. - Chronic inhibition of endoplasmic reticulum stress and inflammation prevents ischaemia-induced vascular pathology in type II diabetic mice.
Amin A, Choi SK, Galan M, Kassan M, Partyka M, Kadowitz P, Henrion D, Trebak M, Belmadani S, Matrougui K. Amin A, et al. J Pathol. 2012 Jun;227(2):165-74. doi: 10.1002/path.3960. Epub 2012 Feb 17. J Pathol. 2012. PMID: 22081301 Free PMC article. - Impact of endoplasmic reticulum stress pathway on pancreatic beta-cells and diabetes mellitus.
Araki E, Oyadomari S, Mori M. Araki E, et al. Exp Biol Med (Maywood). 2003 Nov;228(10):1213-7. doi: 10.1177/153537020322801018. Exp Biol Med (Maywood). 2003. PMID: 14610263 Review. - The Molecular Mechanisms Underlying Mitochondria-Associated Endoplasmic Reticulum Membrane-Induced Insulin Resistance.
Cheng H, Gang X, He G, Liu Y, Wang Y, Zhao X, Wang G. Cheng H, et al. Front Endocrinol (Lausanne). 2020 Nov 23;11:592129. doi: 10.3389/fendo.2020.592129. eCollection 2020. Front Endocrinol (Lausanne). 2020. PMID: 33329397 Free PMC article. Review.
Cited by
- Central nervous system mechanisms linking the consumption of palatable high-fat diets to the defense of greater adiposity.
Ryan KK, Woods SC, Seeley RJ. Ryan KK, et al. Cell Metab. 2012 Feb 8;15(2):137-49. doi: 10.1016/j.cmet.2011.12.013. Epub 2012 Jan 11. Cell Metab. 2012. PMID: 22244528 Free PMC article. Review. - Prognostic Significance of Plasma Insulin Level for Deep Venous Thrombosis in Patients with Severe Traumatic Brain Injury in Critical Care.
Du M, Zhang QH, Tang R, Liu HY, Ji ZS, Gao Z, Wang Y, You HY, Hao JW, Zhou M. Du M, et al. Neurocrit Care. 2023 Apr;38(2):263-278. doi: 10.1007/s12028-022-01588-y. Epub 2022 Sep 16. Neurocrit Care. 2023. PMID: 36114315 - Inhibition of hypothalamic inflammation reverses diet-induced insulin resistance in the liver.
Milanski M, Arruda AP, Coope A, Ignacio-Souza LM, Nunez CE, Roman EA, Romanatto T, Pascoal LB, Caricilli AM, Torsoni MA, Prada PO, Saad MJ, Velloso LA. Milanski M, et al. Diabetes. 2012 Jun;61(6):1455-62. doi: 10.2337/db11-0390. Epub 2012 Apr 20. Diabetes. 2012. PMID: 22522614 Free PMC article. - Exercise activates the PI3K-AKT signal pathway by decreasing the expression of 5α-reductase type 1 in PCOS rats.
Wu C, Jiang F, Wei K, Jiang Z. Wu C, et al. Sci Rep. 2018 May 22;8(1):7982. doi: 10.1038/s41598-018-26210-0. Sci Rep. 2018. PMID: 29789599 Free PMC article. - A comparative study to determine the effects of breed and feed restriction on glucose metabolism of chickens.
Du P, Wang H, Shi X, Zhang X, Zhu Y, Chen W, Zhang H, Huang Y. Du P, et al. Anim Nutr. 2023 Feb 21;13:261-269. doi: 10.1016/j.aninu.2023.02.005. eCollection 2023 Jun. Anim Nutr. 2023. PMID: 37168446 Free PMC article.
References
- Ruan H, Lodish HF. Regulation of insulin sensitivity by adipose tissue-derived hormones and inflammatory cytokines. Curr Opin Lipidol. 2004;15:297–302. - PubMed
- Hotamisligil GS. Inflammation and metabolic disorders. Nature. 2006;444:860–867. - PubMed
- Lehrke M, Lazar MA. Inflamed about obesity. Nat Med. 2004;10:126–127. - PubMed
- Cai D. NFκB-mediated metabolic inflammation in peripheral tissues versus central nervous system. Cell Cycle. 2009;8:2542–2548. - PubMed
Publication types
MeSH terms
Substances
LinkOut - more resources
Full Text Sources
Medical
