CCL25/CCR9 interactions regulate large intestinal inflammation in a murine model of acute colitis - PubMed (original) (raw)
CCL25/CCR9 interactions regulate large intestinal inflammation in a murine model of acute colitis
Marc-Andre Wurbel et al. PLoS One. 2011.
Abstract
Background aims: CCL25/CCR9 is a non-promiscuous chemokine/receptor pair and a key regulator of leukocyte migration to the small intestine. We investigated here whether CCL25/CCR9 interactions also play a role in the regulation of inflammatory responses in the large intestine.
Methods: Acute inflammation and recovery in wild-type (WT) and CCR9(-/-) mice was studied in a model of dextran sulfate sodium (DSS)-induced colitis. Distribution studies and phenotypic characterization of dendritic cell subsets and macrophage were performed by flow cytometry. Inflammatory bowel disease (IBD) scores were assessed and expression of inflammatory cytokines was studied at the mRNA and the protein level.
Results: CCL25 and CCR9 are both expressed in the large intestine and are upregulated during DSS colitis. CCR9(-/-) mice are more susceptible to DSS colitis than WT littermate controls as shown by higher mortality, increased IBD score and delayed recovery. During recovery, the CCR9(-/-) colonic mucosa is characterized by the accumulation of activated macrophages and elevated levels of Th1/Th17 inflammatory cytokines. Activated plasmacytoid dendritic cells (DCs) accumulate in mesenteric lymph nodes (MLNs) of CCR9(-/-) animals, altering the local ratio of DC subsets. Upon re-stimulation, T cells isolated from these MLNs secrete significantly higher levels of TNFα, IFNγ, IL2, IL-6 and IL-17A while down modulating IL-10 production.
Conclusions: Our results demonstrate that CCL25/CCR9 interactions regulate inflammatory immune responses in the large intestinal mucosa by balancing different subsets of dendritic cells. These findings have important implications for the use of CCR9-inhibitors in therapy of human IBD as they indicate a potential risk for patients with large intestinal inflammation.
Conflict of interest statement
Competing Interests: The authors have declared that no competing interests exist.
Figures
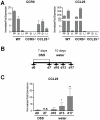
Figure 1. Expression of CCR9 and CCL25 in the large intestine.
(A) Quantification of CCR9 and CCL25 mRNA levels from intestinal tissues of WT, CCR9−/− and CCL25−/− mice. Y-axis shows expression levels normalized to β-actin mRNA (mean +/− SD, n = 3). PP: Peyer's Patches, SI: Small intestine, LI: Large intestine. Data represent the mean +/− SD of 3 independent experiments, performed in triplicate (B) Acute DSS-mediated colitis. Induction phase: 2% DSS in drinking water for 7 days. Recovery: 10 days water. Mice were analyzed at days 0 (d0), d7, d10, d13 and d17. (C) CCL25 mRNA expression increases during the recovery phase of DSS-mediated colitis, (mean +/− SD; d0, n = 3; d10, n = 3; d13, n = 5; d17, n = 5; where n corresponds to a single experiments of 3 to 5 pooled intestinal samples).
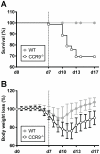
Figure 2. CCR9−/− mice show increased mortality and delayed recovery during DSS-mediated colitis.
(A) 30.65% mortality was observed in CCR9−/− mice (open circles, n = 78). WT mice are shown in gray circles (n = 66). Data are representative of 17 pooled experiments. (B) CCR9−/− mice showed a more pronounced body weight loss than WT. Body weight was monitored daily and is expressed as percent of weight at d0 (data represent the mean +/− SD of 17 pooled experiments of 3–5 mice per group). Open circles show CCR9−/− mice, gray circles WT.
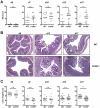
Figure 3. Exacerbation of DSS-mediated colitis in CCR9−/− mice.
(A) Higher IBD scores during the recovery phase in CCR9−/− animals. WT mice are depicted in gray circles (n = 51), CCR9−/− mice in open circles (n = 63). (B) Representative H&E sections from colons of WT and CCR9−/− mice (d0, d13 and d17; 10×-magnification). CCR9−/− intestinal mucosa displays exacerbated IBD symptoms. (C) Significant colon shortening in CCR9−/− mice (open circles) at d17. Colon length was measured from d0 to d17. ***P<0.005, n.s. not significant.
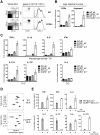
Figure 4. The gastrointestinal tract of CCR9−/− animals shows multiple signs of exacerbated tissue inflammation.
(A) Accumulation of inflammatory macrophages. Flow cytometry analysis of MLNs of WT and CCR9−/− animals. Frequencies of inflammatory macrophages were determined in MLN suspensions with anti-CD11c, CD11b, F4/80, Ly6C and MHC-II (in black) overlaid on isotype control mAbs (in gray). Data represent the mean (+/− SD) of 3 independent experiments of 3–5 pooled mice per genotype. (B and C) mRNA profiling of large intestinal tissues. Total RNA was prepared from the colon of WT and CCR9−/− mice at d0 and d17 and was analyzed with the nCounter™ system (mean +/− SD of 3–5 animals per group of 2 independent experiments). (B) Macrophage accumulation is reflected by increased mRNA levels of CD64 and Arginase1. (C) Comparison of tissue immunophenotype of the large intestinal mucosa before and after DSS-mediated colitis in WT and CCR9−/− animals. (D and E) T cell re-stimulation assay for cytokine production. (D) Representative cytometry bead array assay for Th1/Th2/Th17 cytokines. (E) Production of TNFα, IFNγ, IL-2, IL-6 and IL-17A is upregulated while production of IL-10 and IL-4 is down-regulated in T cells from CCR9−/− animals. Quantification of cytokine production from WT (gray bars) and CCR9−/− cells (open bars). Data represent one experiment out of 3 independent experiments, performed in triplicate (mean +/− SD) of 3 pooled WT MLN and 3 pooled CCR9−/− MLN cell suspensions reactivated in vitro with anti-CD3ε/anti-CD28 mAbs for 72 h.
Figure 5. CCR9−/− mice show altered ratios of dendritic cell subpopulations at steady state and during DSS-mediated colitis.
(A) WT MLNs contain CCR9+ and CCR9− pDCs gated as MHC IIint and PDCA-1high (left dot plot). CCR9 expression in WT pDCs (black line, right histogram) is overlaid on CCR9−/− pDCs (in gray, right histogram) (B) Steady state distribution of pDCs and cDCs is altered in SPL and MLN of CCR9−/− mice. No significant difference between strains is observed in the colon. cDCs were defined as CD11chigh and MHC IIhigh cells by flow cytometry. Ratio of subpopulations is expressed on the y-axis as pDC/cDC cells. Data represent the mean +/− SD of 4 independent experiments of 3–5 pooled mice per group. (C) Accumulation of pDCs in MLNs of CCR9−/− animals. Percentages of pDCs in WT and CCR9−/− MLN are depicted in bold from d0 to d17 of DSS colitis. (D) Accumulation of pDCs correlates with the level of tissue damage. Increase of DSS concentration to 4% augments the number of CCR9low/− B220+ PDCA-1+ MHC IIint/high cells in MLNs of WT animals. (E) DSS-mediated tissue inflammation alters pDC/cDC ratios in MLN of CCR9−/− animals. Data points correspond to individual experiments corresponding to 17 DSS colitis experiments harvested at different time point using 3–5 pooled mice per genotype.
Figure 6. pDCs from CCR9−/− MLNs are more activated than WT pDCs.
(A) pDCs of WT and CCR9−/− mice express low levels of CD11b in contrast to inflammatory macrophages. pDCs were defined as CD11blow MHC IIint/high PDCA-1+. (B) CCR9−/− pDCs show signs of phenotypic maturation. Maturation levels were assessed by comparing expression levels of MHC II and costimulatory molecules CD80 and CD86. (C) Morphology of pDCs isolated from WT and CCR9−/− animals.
Similar articles
- CCL25/CCR9 interactions are not essential for colitis development but are required for innate immune cell protection from chronic experimental murine colitis.
Wurbel MA, Le Bras S, Ibourk M, Pardo M, McIntire MG, Coco D, Geha RS, Fiebiger E, Snapper SB. Wurbel MA, et al. Inflamm Bowel Dis. 2014 Jul;20(7):1165-76. doi: 10.1097/MIB.0000000000000059. Inflamm Bowel Dis. 2014. PMID: 24874458 Free PMC article. - CCL25/CCR9 interactions regulate the function of iNKT cells in oxazolone-induced colitis in mice.
Zhu S, Bing Y, Wang X, Yu Q, Wang Y, Xu S, Song L, Wang X, Xia B, Zhu Y, Zhou R. Zhu S, et al. PLoS One. 2014 Jun 17;9(6):e100167. doi: 10.1371/journal.pone.0100167. eCollection 2014. PLoS One. 2014. PMID: 24936795 Free PMC article. - Role of beta7 integrin and the chemokine/chemokine receptor pair CCL25/CCR9 in modeled TNF-dependent Crohn's disease.
Apostolaki M, Manoloukos M, Roulis M, Wurbel MA, Müller W, Papadakis KA, Kontoyiannis DL, Malissen B, Kollias G. Apostolaki M, et al. Gastroenterology. 2008 Jun;134(7):2025-35. doi: 10.1053/j.gastro.2008.02.085. Epub 2008 Mar 5. Gastroenterology. 2008. PMID: 18439426 - The Regulatory Function of CCR9+ Dendritic Cells in Inflammation and Autoimmunity.
Pathak M, Lal G. Pathak M, et al. Front Immunol. 2020 Oct 2;11:536326. doi: 10.3389/fimmu.2020.536326. eCollection 2020. Front Immunol. 2020. PMID: 33123124 Free PMC article. Review. - CCR9 and CCL25: A review of their roles in tumor promotion.
Xu B, Deng C, Wu X, Ji T, Zhao L, Han Y, Yang W, Qi Y, Wang Z, Yang Z, Yang Y. Xu B, et al. J Cell Physiol. 2020 Dec;235(12):9121-9132. doi: 10.1002/jcp.29782. Epub 2020 May 13. J Cell Physiol. 2020. PMID: 32401349 Review.
Cited by
- Causal Relationships Between Circulating Inflammatory Proteins and Obstructive Sleep Apnea: A Bidirectional Mendelian Randomization Study.
Chen Z, Zeng J, Pei X, Zhao J, Zhao F, Zhang G, Liang K, Li J, Zhao X. Chen Z, et al. Nat Sci Sleep. 2024 Jun 13;16:787-800. doi: 10.2147/NSS.S458637. eCollection 2024. Nat Sci Sleep. 2024. PMID: 38894977 Free PMC article. - Candida tropicalis Affects Candida albicans Virulence by Limiting Its Capacity to Adhere to the Host Intestinal Surface, Leading to Decreased Susceptibility to Colitis in Mice.
Roberts K, Osme A, De Salvo C, Zoli E, Herrada J, McCormick TS, Ghannoum M, Cominelli F, Di Martino L. Roberts K, et al. J Fungi (Basel). 2024 Mar 25;10(4):245. doi: 10.3390/jof10040245. J Fungi (Basel). 2024. PMID: 38667916 Free PMC article. - Retinoid X Receptor agonists as selective modulators of the immune system for the treatment of cancer.
Leal AS, Hung PY, Chowdhury AS, Liby KT. Leal AS, et al. Pharmacol Ther. 2023 Dec;252:108561. doi: 10.1016/j.pharmthera.2023.108561. Epub 2023 Nov 10. Pharmacol Ther. 2023. PMID: 37952906 Review. - Transcriptomic and Metabolomic Changes Reveal the Immunomodulatory Function of Casein Phosphopeptide-Selenium Chelate in Beagle Dogs.
Wang W, Xu L, Cao Y, Liu G, Lin Q, Mao X. Wang W, et al. Vet Sci. 2023 May 12;10(5):345. doi: 10.3390/vetsci10050345. Vet Sci. 2023. PMID: 37235428 Free PMC article. - Intestinal barrier dysfunction as a key driver of severe COVID-19.
Tsounis EP, Triantos C, Konstantakis C, Marangos M, Assimakopoulos SF. Tsounis EP, et al. World J Virol. 2023 Mar 25;12(2):68-90. doi: 10.5501/wjv.v12.i2.68. World J Virol. 2023. PMID: 37033148 Free PMC article. Review.
References
- Vicari AP, Figueroa DJ, Hedrick JA, Foster JS, Singh KP, et al. TECK: a novel CC chemokine specifically expressed by thymic dendritic cells and potentially involved in T cell development. Immunity. 1997;7:291–301. - PubMed
- Papadakis KA, Prehn J, Nelson V, Cheng L, Binder SW, et al. The role of thymus-expressed chemokine and its receptor CCR9 on lymphocytes in the regional specialization of the mucosal immune system. J Immunol. 2000;165:5069–5076. - PubMed
- Wurbel MA, Philippe JM, Nguyen C, Victorero G, Freeman T, et al. The chemokine TECK is expressed by thymic and intestinal epithelial cells and attracts double- and single-positive thymocytes expressing the TECK receptor CCR9. Eur J Immunol. 2000;30:262–271. - PubMed
- Mora JR, Bono MR, Manjunath N, Weninger W, Cavanagh LL, et al. Selective imprinting of gut-homing T cells by Peyer's patch dendritic cells. Nature. 2003;424:88–93. - PubMed
Publication types
MeSH terms
Substances
LinkOut - more resources
Full Text Sources
Molecular Biology Databases


