Hotspots of aberrant epigenomic reprogramming in human induced pluripotent stem cells - PubMed (original) (raw)
. 2011 Mar 3;471(7336):68-73.
doi: 10.1038/nature09798. Epub 2011 Feb 2.
Mattia Pelizzola, Yasuyuki S Kida, R David Hawkins, Joseph R Nery, Gary Hon, Jessica Antosiewicz-Bourget, Ronan O'Malley, Rosa Castanon, Sarit Klugman, Michael Downes, Ruth Yu, Ron Stewart, Bing Ren, James A Thomson, Ronald M Evans, Joseph R Ecker
Affiliations
- PMID: 21289626
- PMCID: PMC3100360
- DOI: 10.1038/nature09798
Hotspots of aberrant epigenomic reprogramming in human induced pluripotent stem cells
Ryan Lister et al. Nature. 2011.
Erratum in
- Nature. 2014 Oct 2;514(7520):126
Abstract
Induced pluripotent stem cells (iPSCs) offer immense potential for regenerative medicine and studies of disease and development. Somatic cell reprogramming involves epigenomic reconfiguration, conferring iPSCs with characteristics similar to embryonic stem (ES) cells. However, it remains unknown how complete the reestablishment of ES-cell-like DNA methylation patterns is throughout the genome. Here we report the first whole-genome profiles of DNA methylation at single-base resolution in five human iPSC lines, along with methylomes of ES cells, somatic cells, and differentiated iPSCs and ES cells. iPSCs show significant reprogramming variability, including somatic memory and aberrant reprogramming of DNA methylation. iPSCs share megabase-scale differentially methylated regions proximal to centromeres and telomeres that display incomplete reprogramming of non-CG methylation, and differences in CG methylation and histone modifications. Lastly, differentiation of iPSCs into trophoblast cells revealed that errors in reprogramming CG methylation are transmitted at a high frequency, providing an iPSC reprogramming signature that is maintained after differentiation.
Figures
Figure 1. Global trends of human iPSC and ES cell DNA methylomes
a, Per cent of all cytosines on each strand of the human genome assayed for each sample. b, c, The per cent of all sequencing base calls that were methylated (C, resistant to bisulphite conversion) at covered C bases in the CG (b) and CH contexts (c) (where H = A, C, or T) throughout the genome, minus the bisulphite non-conversion frequency. d, AnnoJ data browser representation of the restoration of non-CG methylation in all iPSC and ES cell lines. e, Dendrogram of the analysed cell lines based on Pearson correlation of mCG or mCH levels in 1-kb windows throughout the genome.
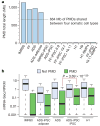
Figure 2. Partially methylated domains become highly methylated on induction of pluripotency
a, Total length of PMDs identified in each cell line and overlap of PMDs identified in the four somatic cell types. b, mRNA-Seq RPKM (reads per kilobase of exon per million reads) values for all RefSeq genes outside PMDs, and all RefSeq genes within genomic regions defined as PMDs. For ADS-iPSC and H1 the ADS PMD genomic regions were used as PMDs. P value is from two-tailed Wilcoxon test between ADS PMDs and ADS-iPSC PMDs.
Figure 3. CG-DMRs identified between pluripotent cells
a, Complete linkage hierarchical clustering of mCG density within CG-DMRs identified between all ES cell and iPSC DNA methylomes. Each CG-DMR was profiled over 20 equally sized bins. b, The CG-DMRs for each iPSC line with respect to H1 and H9 ES cells were categorized as having methylation patterns like the progenitor somatic cell line (memory) or iPSC-specific (iDMR). c, Number of iPSC hypomethylated and hypermethyated CG-DMRs aberrant in the indicated number of iPSC lines. d, Number of all CG-DMRs coincident with indicated genomic and genic features. CGI, CG island; TES, transcriptional end site; TSS, transcriptional start site.
Figure 4. Characterization of CG-DMRs in iPSCs
a, Normalized mCG levels (lower _y_-axis) and normalized H3K27me3 ChIP-Seq read density (upper _y_-axis) over CG-DMRs hypermethylated in all iPSC lines and flanking genomic regions. b, Data browser representation of mRNA, DNA methylation and H3K27me3 density for a CG-DMR identified in all iPSC lines. c, Complete linkage hierarchical clustering of mCG density within the CG-DMRs hypomethylated in both FF-iPSC 19.11 and FF-iPSC 19.11-BMP4 relative to H1, H9 and H1-BMP4 cell lines. Each CG-DMR was profiled over 20 equally sized bins. d, Same as c for hypermethylated CG-DMRs. e, FF-iPSC 19.11 CG-DMR transmission through differentiation to trophoblast cells. CG-DMRs were categorized by methylation state relative to the ES cells (hyper, hypermethylated; hypo, hypomethylated), similarity to somatic progenitor methylation (memory: like progenitor; iDMR: unlike progenitor), and whether the CG-DMR was present in FF-iPSC 19.11 differentiated into trophoblast cells with BMP4 (transmitted) or not (not transmitted).
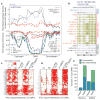
Figure 5. Failure to restore megabase-scale regions of non-CG methylation is a hallmark of iPSC reprogramming
a, Chromosome ideograms and length distribution (inset) of the 22 ADS-iPSC non-CG mega-DMRs. Blue circles and lines indicate location of individual DMRs. Red ellipses indicate the location of centromeres. b, Normalized mCH levels over all non-CG mega-DMRs and flanking genomic regions. c, Lower _y_-axis as in b for the cell lines indicated. Upper _y_-axis shows normalized H3K9me3 ChIP-Seq read density throughout the non-CG mega-DMRs and flanking genomic regions. Dashed blue arrows indicate the inverse relationship between mCH and H3K9me3. d, Plot shows normalized mCG levels over the non-CG mega-DMRs and flanking genomic regions. Inset is a data browser representation of DNA methylation where vertical bar height indicates mC level at the 5′ of a non-CG mega-DMR and PMD. e, Normalized mCH levels over a non-CG mega-DMR on chromosome 22 and flanking regions. Top panel shows gene models and ADS-iPSC mCH. f, Comparison of transcript abundance between H1 and ADS-iPSC. Each dot represents a RefSeq gene within the 22 non-CG mega-DMRs. Red dots indicate genes that have a CG-DMR within 2 kb of the transcriptional start site. Blue dots indicate genes that have a CG-DMR within 2 kb of the transcriptional start site, are hypermethylated in all iPSC lines and are associated with loss of H3K27me3. Red dashed lines represent twofold difference. g, The number of genes with a given transcript abundance ratio between H1 and ADS-iPSCs for all RefSeq genes within the non-CG mega-DMRs.
Comment in
- Stem cells: The dark side of induced pluripotency.
Pera MF. Pera MF. Nature. 2011 Mar 3;471(7336):46-7. doi: 10.1038/471046a. Nature. 2011. PMID: 21368819 No abstract available. - Stem cells: Reprogramming's unintended consequences.
Muers M. Muers M. Nat Rev Genet. 2011 Apr;12(4):230. doi: 10.1038/nrg2975. Epub 2011 Mar 9. Nat Rev Genet. 2011. PMID: 21386865 No abstract available. - iPSCs: induced back to controversy.
Panopoulos AD, Ruiz S, Izpisua Belmonte JC. Panopoulos AD, et al. Cell Stem Cell. 2011 Apr 8;8(4):347-8. doi: 10.1016/j.stem.2011.03.003. Cell Stem Cell. 2011. PMID: 21474093 - Tumour microenvironment: the same, but different.
McCarthy N. McCarthy N. Nat Rev Cancer. 2011 Apr;11(4):232. doi: 10.1038/nrc3045. Nat Rev Cancer. 2011. PMID: 21548395 No abstract available.
Similar articles
- Proteomic and genomic approaches reveal critical functions of H3K9 methylation and heterochromatin protein-1γ in reprogramming to pluripotency.
Sridharan R, Gonzales-Cope M, Chronis C, Bonora G, McKee R, Huang C, Patel S, Lopez D, Mishra N, Pellegrini M, Carey M, Garcia BA, Plath K. Sridharan R, et al. Nat Cell Biol. 2013 Jul;15(7):872-82. doi: 10.1038/ncb2768. Epub 2013 Jun 9. Nat Cell Biol. 2013. PMID: 23748610 Free PMC article. - The Epigenetic Reprogramming Roadmap in Generation of iPSCs from Somatic Cells.
Brix J, Zhou Y, Luo Y. Brix J, et al. J Genet Genomics. 2015 Dec 20;42(12):661-70. doi: 10.1016/j.jgg.2015.10.001. Epub 2015 Oct 23. J Genet Genomics. 2015. PMID: 26743984 Review. - X Chromosome Dosage Influences DNA Methylation Dynamics during Reprogramming to Mouse iPSCs.
Pasque V, Karnik R, Chronis C, Petrella P, Langerman J, Bonora G, Song J, Vanheer L, Sadhu Dimashkie A, Meissner A, Plath K. Pasque V, et al. Stem Cell Reports. 2018 May 8;10(5):1537-1550. doi: 10.1016/j.stemcr.2018.03.019. Epub 2018 Apr 19. Stem Cell Reports. 2018. PMID: 29681539 Free PMC article. - Subtelomeric hotspots of aberrant 5-hydroxymethylcytosine-mediated epigenetic modifications during reprogramming to pluripotency.
Wang T, Wu H, Li Y, Szulwach KE, Lin L, Li X, Chen IP, Goldlust IS, Chamberlain SJ, Dodd A, Gong H, Ananiev G, Han JW, Yoon YS, Rudd MK, Yu M, Song CX, He C, Chang Q, Warren ST, Jin P. Wang T, et al. Nat Cell Biol. 2013 Jun;15(6):700-11. doi: 10.1038/ncb2748. Epub 2013 May 19. Nat Cell Biol. 2013. PMID: 23685628 Free PMC article. - DNA methylation dynamics in human induced pluripotent stem cells.
Nishino K, Umezawa A. Nishino K, et al. Hum Cell. 2016 Jul;29(3):97-100. doi: 10.1007/s13577-016-0139-5. Epub 2016 Apr 15. Hum Cell. 2016. PMID: 27083573 Review.
Cited by
- Pluripotency of induced pluripotent stem cells.
Kang L, Gao S. Kang L, et al. J Anim Sci Biotechnol. 2012 Feb 28;3(1):5. doi: 10.1186/2049-1891-3-5. J Anim Sci Biotechnol. 2012. PMID: 22958434 Free PMC article. - Cellular reprogramming: a small molecule perspective.
Nie B, Wang H, Laurent T, Ding S. Nie B, et al. Curr Opin Cell Biol. 2012 Dec;24(6):784-92. doi: 10.1016/j.ceb.2012.08.010. Epub 2012 Sep 7. Curr Opin Cell Biol. 2012. PMID: 22959962 Free PMC article. Review. - Epigenome-wide inheritance of cytosine methylation variants in a recombinant inbred population.
Schmitz RJ, He Y, Valdés-López O, Khan SM, Joshi T, Urich MA, Nery JR, Diers B, Xu D, Stacey G, Ecker JR. Schmitz RJ, et al. Genome Res. 2013 Oct;23(10):1663-74. doi: 10.1101/gr.152538.112. Epub 2013 Jun 5. Genome Res. 2013. PMID: 23739894 Free PMC article. - Breaking through an epigenetic wall: re-activation of Oct4 by KRAB-containing designer zinc finger transcription factors.
Juárez-Moreno K, Erices R, Beltran AS, Stolzenburg S, Cuello-Fredes M, Owen GI, Qian H, Blancafort P. Juárez-Moreno K, et al. Epigenetics. 2013 Feb;8(2):164-76. doi: 10.4161/epi.23503. Epub 2013 Jan 11. Epigenetics. 2013. PMID: 23314702 Free PMC article. - Characterization of a unique technique for culturing primary adult human epithelial progenitor/"stem cells".
Marcelo CL, Peramo A, Ambati A, Feinberg SE. Marcelo CL, et al. BMC Dermatol. 2012 Jun 24;12:8. doi: 10.1186/1471-5945-12-8. BMC Dermatol. 2012. PMID: 22726819 Free PMC article.
References
- Yamanaka S. A fresh look at iPS cells. Cell. 2009;137:13–17. - PubMed
- Takahashi K, Yamanaka S. Induction of pluripotent stem cells from mouse embryonic and adult fibroblast cultures by defined factors. Cell. 2006;126:663–676. - PubMed
- Takahashi K, et al. Induction of pluripotent stem cells from adult human fibroblasts by defined factors. Cell. 2007;131:861–872. - PubMed
- Yu J, et al. Induced pluripotent stem cell lines derived from human somatic cells. Science. 2007;318:1917–1920. - PubMed
Publication types
MeSH terms
Substances
Grants and funding
- U19 DK062434/DK/NIDDK NIH HHS/United States
- U01 ES017166-01/ES/NIEHS NIH HHS/United States
- U01 ES017166/ES/NIEHS NIH HHS/United States
- HHMI_/Howard Hughes Medical Institute/United States
- P30 CA014195/CA/NCI NIH HHS/United States
LinkOut - more resources
Full Text Sources
Other Literature Sources
Molecular Biology Databases


