Cells respond to mechanical stress by rapid disassembly of caveolae - PubMed (original) (raw)
. 2011 Feb 4;144(3):402-13.
doi: 10.1016/j.cell.2010.12.031.
Darius Köster, Richard Ruez, Pauline Gonnord, Michele Bastiani, Daniel Abankwa, Radu V Stan, Gillian Butler-Browne, Benoit Vedie, Ludger Johannes, Nobuhiro Morone, Robert G Parton, Graça Raposo, Pierre Sens, Christophe Lamaze, Pierre Nassoy
Affiliations
- PMID: 21295700
- PMCID: PMC3042189
- DOI: 10.1016/j.cell.2010.12.031
Cells respond to mechanical stress by rapid disassembly of caveolae
Bidisha Sinha et al. Cell. 2011.
Abstract
The functions of caveolae, the characteristic plasma membrane invaginations, remain debated. Their abundance in cells experiencing mechanical stress led us to investigate their role in membrane-mediated mechanical response. Acute mechanical stress induced by osmotic swelling or by uniaxial stretching results in a rapid disappearance of caveolae, in a reduced caveolin/Cavin1 interaction, and in an increase of free caveolins at the plasma membrane. Tether-pulling force measurements in cells and in plasma membrane spheres demonstrate that caveola flattening and disassembly is the primary actin- and ATP-independent cell response that buffers membrane tension surges during mechanical stress. Conversely, stress release leads to complete caveola reassembly in an actin- and ATP-dependent process. The absence of a functional caveola reservoir in myotubes from muscular dystrophic patients enhanced membrane fragility under mechanical stress. Our findings support a new role for caveolae as a physiological membrane reservoir that quickly accommodates sudden and acute mechanical stresses.
Copyright © 2011 Elsevier Inc. All rights reserved.
Figures
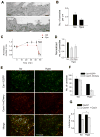
Figure 1. Mechanical Stress Induces Partial Disappearance of Caveolae
(A) YZ maximum-intensity projection of confocal stacks of Cav1-EGFP HeLa cells. Projection of 4 cells under iso-osmotic conditions (Iso), hypo-osmotic conditions (Hypo, 5 min), and 3 min after returning to iso-osmolarity (Rec). Bar = 5 μm. Dashed lines mark out the initial cell boundary. (B) Volume of Cav1-EGFP HeLa cells tracked from (and normalized to) iso-osmotic conditions through hypo-osmotic shock (onset: t = 0 min) and upon returning to iso-osmolarity (t ~ 29 min). Arrow indicates return to iso-osmolarity. Data derived from multiple measurements (N = 5) in 3 independent experiments. Error bars represent standard deviations (SD). (C) TIRF images of Cav1-EGFP HeLa cells under iso-osmotic conditions (Iso) and after 4 min hypo-osmotic shock (Hypo). Dotted line marks out the cell footprint. Bar = 5 μm. (D) Change in the number of caveolae for single Cav1-EGFP HeLa cells after hypo-osmotic shock (Hypo) normalized to the number counted before hypo-osmotic shock (Iso) (N = 18). Error bars represent SD (p = 4E-11). (E) Evolution of the loss of caveolae per cell with decreasing osmolarity. The same Cav1-EGFP HeLa cells were exposed to decreasing osmolarities during ~ 1 min for each osmolarity. From correlation analysis, the loss of caveolae is positively correlated with the decrease in external osmolarity (r2 = 0.85). Error bars represent SD (N = 3). (F) TIRF images of a Cav1-EGFP HeLa cell on the stretching device at 0% (left), and 20% stretch (right). Dotted lines mark out cell boundaries before and after stretch. Bar = 5 μm. (G) Change in number of caveolae for single Cav1-EGFP HeLa cells after stretching (15 ± 1 %) normalized to the number counted before stretching. Data derived from multiple measurements (N = 7, p = 0.00033) in 7 independent experiments. (H) Evolution of the number of caveolae for single Cav1-EGFP HeLa cells stretched to different lengths characterized by (L−L0)/L0 where L0 and L are the initial and final lengths of the cell footprint in the stretching direction. Each point is measured on a single cell. The number of caveolae is found to be negatively correlated to the extent of stretch (N = 7, r2 = 0.85) as measured in 7 independent experiments.
Figure 2. Caveolae Morphology and Cav1-Cavin1 Interaction is Lost Upon Hypo-Osmotic Shock
(A) Ultrathin cryosections of wt MLEC before (Iso) and 5 min after (Hypo) switch to hypo-osmotic medium examined by EM. Arrows mark out caveolae. Bar = 150 nm. (B) Quantification of caveolae detected per μm of plasma membrane on ultrathin cryosections of wt MLEC before (Iso) and 5 min after switch to hypo-osmotic medium (Hypo) reveals a significant decrease (p = 0.047) in the number of caveolae after hypo-osmotic shock. Total membrane used for quantification was 76 and 67 μm for iso- and hypo-osmotic conditions, respectively, imaged from different sections of multiple randomly selected cells (> 10). Data represents mean ± SD. (C) Time evolution of caveolae number (±SD) detected by TIRF in control (Ctrl) and dynasore treated cells (Dyn) normalized to the caveolae number before addition of dynasore (t = −5 min). Dynasore was added at t = 0 and hypo-osmotic shock was applied at t ~ 45 min (30 mOsm, shaded region). Error bars show SD, N = 4. (D) Change in number of caveolae for single cells in control (Ctrl) and in dynasore treated cells (Dyn) after hypo-osmotic shock normalized to the number before shock (Iso) (N = 9). Error bars show SD (p = 1E-4). (E) TIRF images of HeLa cells expressing Cavin1-mCherry and Cav1-EGFP before (Iso) and 5 min after switch to hypo-osmotic conditions (Hypo). Bar = 10 μm. (F) Change in number of Cav1 and Cavin-1 structures per cell before and after hypo-osmotic shock of 5 min. Error bars show SD (N = 3). (G) HeLa cells transiently expressing Cavin1-EGFP with or without Cav3-mRFP were exposed to iso-osmotic (Iso) or hypo-osmotic (Hypo) media for 15 min and analyzed by FLIM. Data represent mean EGFP fluorescence lifetime ± standard errors (SE). N = 40–70 cells; *p < 4E-12.
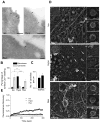
Figure 3. Caveolae Flatten out and Disassemble on Hypo-Osmotic Shock, and Reassemble on Recovering Iso-Osmolarity
(A) Immuno-EM images of ultrathin cryosections with gold-tagged Cav1 antibody of wt MLEC under iso-osmotic (Iso), hypo-osmotic (Hypo, 5 min) and recovered iso-osmotic (Rec, 5 min) conditions. Bar = 150 nm. See also Figure S2A. (B) Percentage of gold particles found in caveolae and endosomal structures close to the plasma membrane versus those found on non-caveolar membranes (*p = 4E-3, **p=4E-2, ***p=1E-3). Total membrane used for quantification was 23, 24, and 35 μm, respectively, for iso-osmotic, hypo-osmotic, and recovered iso-osmotic conditions, imaged from different sections of multiple cells. (C) Comparison between the number of caveolae per μm of membrane before hypo-osmotic shock (Iso) and after return to iso-osmotic medium (Rec) analyzed from ultrathin cryosections of wt MLEC using 60 μm of membrane imaged from different sections (N = 8) of multiple cells. Data represent mean ± SE (p = 1E-2). (D) Deep-etched EM images of MLECs under iso-osmotic (Iso), hypo-osmotic (Hypo, 5 min), and recovered iso-osmotic (Rec, 5 min) conditions. Bar = 200 nm. Left insets depict representative images of clathrin-coated pits. Right images depict representative images of caveolae. Bar (insets) = 100 nm. See also Figure S2B. (E) Fluorescence Recovery After Photobleaching (FRAP) of Cav1-EGFP in HeLa cells in iso-osmotic (Iso; N = 8), hypo-osmotic (Hypo; N = 8), and recovered iso-osmotic conditions (Rec; N = 8). Lines show fit for the curves to standard recovery equation. Hypo-osmotic shock results in a statistically higher fluorescence recovery (p = 2E-4) than in iso-osmotic conditions. Data represents mean ± SE.
Figure 4. Caveolae Buffer the Membrane Tension Rise During Hypo-Osmotic Shock
(A) Representative force curves for tethers extracted from wt MLEC, Cav1−/− MLEC, Cav1−/− MLEC transfected with Cav1-EGFP, and wt MLEC treated with mβCD exposed to hypo-osmotic shock (150 mOsm). Hypo-osmotic shock is indicated by an arrow (break from1.34 to 2.7 min). (B) Relative change of the mean tether force after hypo-osmotic shock (5min) for wt (N = 9), and Cav1−/− MLEC (N = 9, p = 0.01502), wt (N = 3) and Cav1−/− MEFs (N = 4, p = 8E-4) and HeLa cells (N = 4). Data represent mean ± SE. See text for details. (C) Cav3 immunostaining in differentiated wt and Cav3-P28L human myotubes. Bar = 5 μm. (D) Relative change of the mean tether force after hypo-osmotic shock (5 min) for wt (N = 11) and P28L myotubes (N = 12, p = 5E-8). Data represent mean ± SE.
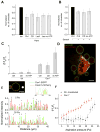
Figure 5. Membrane Tension Surge Buffering by Caveolae Flattening Occurs in an ATP and Actin Independent Process
(A) Normalized number of caveolae per cell after hypo-osmotic shock (Hypo). Reference is the number before hypo-osmotic shock (Iso) for control cells (Ctrl; N = 18). Reference is the number after the drug treatment and before hypo-osmotic shock for cytochalasin D (CD; N = 10, p = 2E-5), latrunculin A (Lat; N = 21, p = 7E-11), jasplakinolide (Jas, N = 11, p = 6E-8) treated cells, and ATP depleted cells (no ATP; N = 10, p = 2E-5). Data represent mean ± SD. (B) Change in number of caveolae for single HeLa Cav1-EGFP cells after stretching (15 ± 1 %). Same normalization as in (A) for control cells (N = 7, p = 3E-4), and for cells treated with cytochalasin D (CD, N = 5, p = 0.01) and ATP depleted cells (no ATP, N = 5, p = 0.04). Data represent mean ± SD. (C) Relative change of the tether force after hypo-osmotic shock (5min) for wt and Cav1−/− MLEC for control (Ctrl; N = 9 for wt, and for Cav1−/− N = 5, p = 0.015), cytochalasin D treated (CD; N = 9 for wt, and for Cav1−/− N = 10, p = 3E-5), and ATP depleted (no ATP; N = 6 for wt, and for Cav1−/− N = 5, p = 2E-4) cells. Data represent mean ± SE. (D) Confocal image of a wt MLEC transfected with Cav1-EGFP (green) and Cavin1-mCherry (red) after incubation for 6 hrs in PMS buffer. Bar = 10 μm. (E) Top: Confocal image of a PMS positive for Cavin1-mCherry (red) and Cav1-EGFP (green) after micropipette aspiration (white lines) and formation of a membrane tether with an optically trapped bead (white disk). Bar = 10 μm. Bottom: Line scans of cavin1-mCherry (red) and Cav1-EGFP (green) normalized intensity along the circumference of the PMS shown above for two aspiration pressures. Arrows indicate regions of co-localization. (F) Relative change of the tether force as a function of the micropipette aspiration pressure in PMS obtained from Cav1-GFP + Cavin1-mCherry MLEC (black squares), and from Cav1−/− MLEC (Cav1−/−, red triangles). Data were obtained in 8 independent experiments and represent the mean value of 60 sec measurements ± SD.
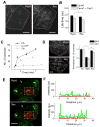
Figure 6. Caveolae Reassembly at the Plasma Membrane upon Recovering Iso-osmolarity
(A) TIRF imaging of caveolae reassembly after shifting from hypo-osmotic (Hypo) to iso-osmotic (Rec) conditions. Dotted line marks out the cell boundary. Bar = 5 μm. (B) HeLa cells transiently expressing Cavin1-EGFP with or without Cav3-mRFP were exposed to hypo-osmotic medium (Hypo) for 15 min followed by iso-osmotic medium (Rec) for 10 min, and analyzed by FLIM. Data represent mean EGFP fluorescence lifetime ± SE (N = 40–60 cells; *p = 8E-7). (C) After hypo-osmotic shock (15 min), cells were returned to iso-osmolarity (t = 0 min). Data represent the number of caveolae per cell for cytochalasin D treated (CD), ATP depleted (no ATP) and control cells (Ctrl). Error bars depict SD. (D) Left panel: TIRF images show a typical BFA treated cell after 15 min hypo-osmotic shock (Hypo), and after 3 min of recovering iso-osmolarity. Bar = 10 μm. Right panel: Quantification of the number of caveolae before hypo-osmotic shock, after 15 min hypo-osmotic shock, and after 3 min of recovery to iso-osmotic conditions in BFA-treated (N = 3) and control cells (N > 10). *p = 8E-29, **p=1E-22. (E) Cav1-Dendra2 photoconversion from green to red fluorescence at the Golgi apparatus (--- rectangle) of HeLa cells followed through hypo-osmotic shock and recovery to iso-osmotic conditions. Arrow marks out the section of the plasma membrane used for plotting intensity profiles. (F) Intensity profiles of green (Cav1-Dendra2) and red (photoconverted Cav1-Dendra2) fluorescence at the plasma membrane before (top) and after (bottom) switch from hypo-osmotic to iso-osmotic conditions.
Figure 7. Cells Respond to Acute Mechanical Stresses by Rapid Disassembly and Reassembly of Caveolae
In resting conditions, caveolae present at the plasma membrane are mostly budded. Magnification shows oligomerized Cav1 and Cavin1 in the caveolar structure. Upon acute mechanical stress (hypo-osmotic shock or stretching), caveolae flatten out in the plasma membrane to provide additional membrane and buffer membrane tension. Magnification shows disassembly and diffusion of Cav1 in the plasma membrane and loss of interaction between Cav1 and Cavin1. Return to resting conditions allows the reassembly of the caveolar structure together with Cavin1 interaction. This cycle represents the primary cell response to an acute mechanical stress.
Comment in
- Need tension relief fast? Try caveolae.
Mayor S. Mayor S. Cell. 2011 Feb 4;144(3):323-4. doi: 10.1016/j.cell.2011.01.018. Cell. 2011. PMID: 21295694
Similar articles
- Caveola mechanotransduction reinforces the cortical cytoskeleton to promote epithelial resilience.
Brooks JW, Tillu V, Eckert J, Verma S, Collins BM, Parton RG, Yap AS. Brooks JW, et al. Mol Biol Cell. 2023 Nov 1;34(12):ar120. doi: 10.1091/mbc.E23-05-0163. Epub 2023 Sep 6. Mol Biol Cell. 2023. PMID: 37672337 Free PMC article. - Lymphocyte transcellular migration occurs through recruitment of endothelial ICAM-1 to caveola- and F-actin-rich domains.
Millán J, Hewlett L, Glyn M, Toomre D, Clark P, Ridley AJ. Millán J, et al. Nat Cell Biol. 2006 Feb;8(2):113-23. doi: 10.1038/ncb1356. Epub 2006 Jan 22. Nat Cell Biol. 2006. PMID: 16429128 - Evolutionary analysis and molecular dissection of caveola biogenesis.
Kirkham M, Nixon SJ, Howes MT, Abi-Rached L, Wakeham DE, Hanzal-Bayer M, Ferguson C, Hill MM, Fernandez-Rojo M, Brown DA, Hancock JF, Brodsky FM, Parton RG. Kirkham M, et al. J Cell Sci. 2008 Jun 15;121(Pt 12):2075-86. doi: 10.1242/jcs.024588. Epub 2008 May 27. J Cell Sci. 2008. PMID: 18505796 - Stressing caveolae new role in cell mechanics.
Nassoy P, Lamaze C. Nassoy P, et al. Trends Cell Biol. 2012 Jul;22(7):381-9. doi: 10.1016/j.tcb.2012.04.007. Epub 2012 May 20. Trends Cell Biol. 2012. PMID: 22613354 Review. - The association of caveolae, actin, and the dystrophin-glycoprotein complex: a role in smooth muscle phenotype and function?
Halayko AJ, Stelmack GL. Halayko AJ, et al. Can J Physiol Pharmacol. 2005 Oct;83(10):877-91. doi: 10.1139/y05-107. Can J Physiol Pharmacol. 2005. PMID: 16333360 Review.
Cited by
- The molecular organization of differentially curved caveolae indicates bendable structural units at the plasma membrane.
Matthaeus C, Sochacki KA, Dickey AM, Puchkov D, Haucke V, Lehmann M, Taraska JW. Matthaeus C, et al. Nat Commun. 2022 Nov 24;13(1):7234. doi: 10.1038/s41467-022-34958-3. Nat Commun. 2022. PMID: 36433988 Free PMC article. - Cell spreading area regulates clathrin-coated pit dynamics on micropatterned substrate.
Tan X, Heureaux J, Liu AP. Tan X, et al. Integr Biol (Camb). 2015 Sep;7(9):1033-43. doi: 10.1039/c5ib00111k. Epub 2015 Jul 24. Integr Biol (Camb). 2015. PMID: 26205141 Free PMC article. - Time-resolved proximity proteomics uncovers a membrane tension-sensitive caveolin-1 interactome at the rear of migrating cells.
Martin E, Girardello R, Dittmar G, Ludwig A. Martin E, et al. Elife. 2024 Sep 24;13:e85601. doi: 10.7554/eLife.85601. Elife. 2024. PMID: 39315773 Free PMC article. - A high throughput cell stretch device for investigating mechanobiology in vitro.
Pratt SJP, Plunkett CM, Kuzu G, Trinh T, Barbara J, Choconta P, Quackenbush D, Huynh T, Smith A, Barnes SW, New J, Pierce J, Walker JR, Mainquist J, King FJ, Elliott J, Hammack S, Decker RS. Pratt SJP, et al. APL Bioeng. 2024 Jun 26;8(2):026129. doi: 10.1063/5.0206852. eCollection 2024 Jun. APL Bioeng. 2024. PMID: 38938688 Free PMC article. - Loss of Caveolin-1 and caveolae leads to increased cardiac cell stiffness and functional decline of the adult zebrafish heart.
Grivas D, González-Rajal Á, Guerrero Rodríguez C, Garcia R, de la Pompa JL. Grivas D, et al. Sci Rep. 2020 Jul 30;10(1):12816. doi: 10.1038/s41598-020-68802-9. Sci Rep. 2020. PMID: 32733088 Free PMC article.
References
- Boyd NL, Park H, Yi H, Boo YC, Sorescu GP, Sykes M, Jo H. Chronic shear induces caveolae formation and alters ERK and Akt responses in endothelial cells. Am J Physiol Heart Circ Physiol. 2003;285:H1113–1122. - PubMed
- Chen CS, Mrksich M, Huang S, Whitesides GM, Ingber DE. Geometric control of cell life and death. Science. 1997;276:1425–1428. - PubMed
- Dai J, Sheetz MP. Regulation of endocytosis, exocytosis, and shape by membrane tension. Cold Spring Harb Symp Quant Biol. 1995;60:567–571. - PubMed
Publication types
MeSH terms
Substances
Grants and funding
- HL92085/HL/NHLBI NIH HHS/United States
- R01 HL092085-02/HL/NHLBI NIH HHS/United States
- R01 HL083249-03/HL/NHLBI NIH HHS/United States
- HL83249/HL/NHLBI NIH HHS/United States
- R01 HL083249-02/HL/NHLBI NIH HHS/United States
- R01 HL083249/HL/NHLBI NIH HHS/United States
- R01 HL083249-01/HL/NHLBI NIH HHS/United States
- R01 HL083249-04/HL/NHLBI NIH HHS/United States
- R01 HL092085-01A1/HL/NHLBI NIH HHS/United States
- R01 HL092085/HL/NHLBI NIH HHS/United States
LinkOut - more resources
Full Text Sources
Other Literature Sources


