Expanding coverage of the metabolome for global metabolite profiling - PubMed (original) (raw)
. 2011 Mar 15;83(6):2152-61.
doi: 10.1021/ac102981k. Epub 2011 Feb 17.
Affiliations
- PMID: 21329365
- PMCID: PMC3285547
- DOI: 10.1021/ac102981k
Expanding coverage of the metabolome for global metabolite profiling
Oscar Yanes et al. Anal Chem. 2011.
Abstract
Mass spectrometry-based metabolomics is the comprehensive study of naturally occurring small molecules collectively known as the metabolome. Given the vast structural diversity and chemical properties of endogenous metabolites, biological extraction and chromatography methods bias the number, property, and concentration of metabolites detected by mass spectrometry and creates a challenge for global untargeted studies. In this work, we used Escherichia coli bacterial cells to explore the influence of solvent polarity, temperature, and pH in extracting polar and nonpolar metabolites simultaneously. In addition, we explored chromatographic conditions involving different stationary and mobile phases that optimize the separation and ionization of endogenous metabolite extracts as well as a mixture of synthetic standards. Our results reveal that hot polar solvents are the most efficient in extracting both hydrophilic and hydrophobic metabolites simultaneously. In addition, ammonium fluoride in the mobile phase substantially improved ionization efficiency in negative electrospray ionization mode by an average increase in signal intensity of 5.7 and over a 2-fold increase in the total number of features detected. The improvement in sensitivity with ammonium fluoride resulted in 3.5 times as many metabolite hits in databases compared to ammonium acetate or formic acid enriched mobile phases and allowed for the identification of unique metabolites involved in fundamental cellular pathways.
Figures
Figure 1
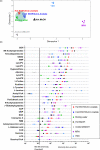
(A). Two-dimensional representation of the XCMS matrix of retention time, m/z, and feature intensity values using a multidimensional scaling (MDS) plot. Data points for extraction methods producing similar features are closer to one another than data points for extraction methods producing more dissimilar features. (B) Quantification of 31 identified metabolites extracted from E.coli using seven different methods and analyzed with a C18 column (Cogent Bidentate) in positive ionization mode. Data points and error bars represent mean intensity values and s.d. for three replicates. The black solid vertical line indicates the intensity threshold required for tandem mass spectrometry, as established from our experimental conditions. Parent ions below this threshold produced fragment ions with low signal-to-noise ratio (i.e., at background noise level). The intensity scale of the X axis is log 10. LysoPC: lysophosphatidylcholine; LysoPE: lysophosphatidylethanolamine.
Figure 2
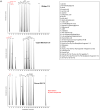
Extracted ion chromatograms of 31 standard compounds separated by reverse-phase chromatography using a (A) XBridge C18, (B) Cogent Bidentate C18, and (C) Scherzo SM-C18 column.
Figure 3
Quantification of 36 standard compounds analyzed in negative ionization mode (ESI−) using three different additives in the mobile phase: 1mM ammonium fluoride, 5mM ammonium acetate, or 0.1% formic acid. Compounds were separated by reverse-phase chromatography using a XBridge C18 column. Fold values indicate the difference in intensity between ammonium fluoride and the closest mobile phase. The intensity scale of the X axis is log 10.
Figure 4
(A) Venn diagram representing the total number of features from LC/MS data of E.coli samples extracted using the method “Boiling water”, and analyzed using ammonium acetate or ammonium fluoride enriched mobile phases. (B) Quantification of 39 metabolites from E.coli analyzed using ammonium acetate and ammonium fluoride enriched mobile phases. The intensity scale of the X axis is log 2. Metabolites were separated by reverse-phase chromatography using an XBridge C18 column and detected in negative ionization mode (ESI−). Identification is based on accurate mass and MS/MS data. Fold values indicate the difference in intensity between ammonium fluoride and ammonium acetate. Examples of unique metabolites detected with ammonium fluoride are also represented. Data points and error bars represent mean intensity values and s.d. for three replicates.
Similar articles
- Comparison of underivatized silica and zwitterionic sulfobetaine hydrophilic interaction liquid chromatography stationary phases for global metabolomics of human plasma.
Sonnenberg RA, Naz S, Cougnaud L, Vuckovic D. Sonnenberg RA, et al. J Chromatogr A. 2019 Dec 20;1608:460419. doi: 10.1016/j.chroma.2019.460419. Epub 2019 Aug 8. J Chromatogr A. 2019. PMID: 31439439 - Analysis of polar urinary metabolites for metabolic phenotyping using supercritical fluid chromatography and mass spectrometry.
Sen A, Knappy C, Lewis MR, Plumb RS, Wilson ID, Nicholson JK, Smith NW. Sen A, et al. J Chromatogr A. 2016 Jun 3;1449:141-55. doi: 10.1016/j.chroma.2016.04.040. Epub 2016 Apr 19. J Chromatogr A. 2016. PMID: 27143232 Free PMC article. - Translational Metabolomics of Head Injury: Exploring Dysfunctional Cerebral Metabolism with Ex Vivo NMR Spectroscopy-Based Metabolite Quantification.
Wolahan SM, Hirt D, Glenn TC. Wolahan SM, et al. In: Kobeissy FH, editor. Brain Neurotrauma: Molecular, Neuropsychological, and Rehabilitation Aspects. Boca Raton (FL): CRC Press/Taylor & Francis; 2015. Chapter 25. In: Kobeissy FH, editor. Brain Neurotrauma: Molecular, Neuropsychological, and Rehabilitation Aspects. Boca Raton (FL): CRC Press/Taylor & Francis; 2015. Chapter 25. PMID: 26269925 Free Books & Documents. Review. - LC-MS metabolomics of polar compounds.
Rojo D, Barbas C, Rupérez FJ. Rojo D, et al. Bioanalysis. 2012 Jun;4(10):1235-43. doi: 10.4155/bio.12.100. Bioanalysis. 2012. PMID: 22651567 Review.
Cited by
- Universal method to determine acidic licit and illicit drugs and personal care products in water by liquid chromatography quadrupole time-of-flight.
Andrés-Costa MJ, Carmona E, Picó Y. Andrés-Costa MJ, et al. MethodsX. 2016 Apr 13;3:307-14. doi: 10.1016/j.mex.2016.04.004. eCollection 2016. MethodsX. 2016. PMID: 27144129 Free PMC article. - Unified-Hydrophilic-Interaction/Anion-Exchange Liquid Chromatography Mass Spectrometry (Unified-HILIC/AEX/MS): A Single-Run Method for Comprehensive and Simultaneous Analysis of Polar Metabolome.
Nakatani K, Izumi Y, Takahashi M, Bamba T. Nakatani K, et al. Anal Chem. 2022 Dec 6;94(48):16877-16886. doi: 10.1021/acs.analchem.2c03986. Epub 2022 Nov 25. Anal Chem. 2022. PMID: 36426757 Free PMC article. - Credentialing features: a platform to benchmark and optimize untargeted metabolomic methods.
Mahieu NG, Huang X, Chen YJ, Patti GJ. Mahieu NG, et al. Anal Chem. 2014 Oct 7;86(19):9583-9. doi: 10.1021/ac503092d. Epub 2014 Sep 22. Anal Chem. 2014. PMID: 25160088 Free PMC article. - The ABRF Metabolomics Research Group 2013 Study: Investigation of Spiked Compound Differences in a Human Plasma Matrix.
Cheema AK, Asara JM, Wang Y, Neubert TA, Tolstikov V, Turck CW. Cheema AK, et al. J Biomol Tech. 2015 Sep;26(3):83-9. doi: 10.7171/jbt.15-2603-001. J Biomol Tech. 2015. PMID: 26290656 Free PMC article. - Metabolomics reveals novel blood plasma biomarkers associated to the BRCA1-mutated phenotype of human breast cancer.
Roig B, Rodríguez-Balada M, Samino S, Lam EW, Guaita-Esteruelas S, Gomes AR, Correig X, Borràs J, Yanes O, Gumà J. Roig B, et al. Sci Rep. 2017 Dec 19;7(1):17831. doi: 10.1038/s41598-017-17897-8. Sci Rep. 2017. PMID: 29259228 Free PMC article.
References
- Nordstrom A, Want E, Northen T, Lehtio J, Siuzdak G. Anal Chem. 2008;80(2):421–9. - PubMed
- Want EJ, Nordstrom A, Morita H, Siuzdak G. J Proteome Res. 2007;6(2):459–68. - PubMed
Publication types
MeSH terms
Substances
Grants and funding
- L30 AG0 038036/AG/NIA NIH HHS/United States
- P30 MH062261/MH/NIMH NIH HHS/United States
- P01 DA026146/DA/NIDA NIH HHS/United States
- L30 AG038036-01/AG/NIA NIH HHS/United States
- R24 EY017540-04/EY/NEI NIH HHS/United States
- L30 AG038036/AG/NIA NIH HHS/United States
- P01 DA026146-02/DA/NIDA NIH HHS/United States
- P30 MH062261-10/MH/NIMH NIH HHS/United States
- R24 EY017540/EY/NEI NIH HHS/United States
LinkOut - more resources
Full Text Sources
Other Literature Sources


