Stable kinesin and dynein assemblies drive the axonal transport of mammalian prion protein vesicles - PubMed (original) (raw)
Stable kinesin and dynein assemblies drive the axonal transport of mammalian prion protein vesicles
Sandra E Encalada et al. Cell. 2011.
Abstract
Kinesin and dynein are opposite-polarity microtubule motors that drive the tightly regulated transport of a variety of cargoes. Both motors can bind to cargo, but their overall composition on axonal vesicles and whether this composition directly modulates transport activity are unknown. Here we characterize the intracellular transport and steady-state motor subunit composition of mammalian prion protein (PrP(C)) vesicles. We identify Kinesin-1 and cytoplasmic dynein as major PrP(C) vesicle motor complexes and show that their activities are tightly coupled. Regulation of normal retrograde transport by Kinesin-1 is independent of dynein-vesicle attachment and requires the vesicle association of a complete Kinesin-1 heavy and light chain holoenzyme. Furthermore, motor subunits remain stably associated with stationary as well as with moving vesicles. Our data suggest a coordination model wherein PrP(C) vesicles maintain a stable population of associated motors whose activity is modulated by regulatory factors instead of by structural changes to motor-cargo associations.
Copyright © 2011 Elsevier Inc. All rights reserved.
Figures
Figure 1. PrPC Vesicles are Transported Bidirectionally in Wild-type Hippocampal Axons
(A) Top panels: sequential images of YFP-PrPC vesicle movement in a hippocampal axon. Vesicles moving bidirectionally (*), in a retrograde direction (•), and a stationary one (◊) are followed for a period of 14 seconds. Middle panel: kymograph generated from movie in (A). Bottom panel: same kymograph depicting individual particle traces generated by particle tracking software. (B) Population breakdown of YFP-PrPC vesicles. (C) Mean segmental velocity; (D) Segmental velocity histograms. Red lines show mean. (E) run length, (F) pause duration, and (G) pause frequency of YFP-PrPC vesicles. Nv = # vesicles; Np = # pauses; Nt = # tracks; Ns = # segments. All values are shown as mean ± SEM. See also Figure S1.
Figure 2. PrPC Vesicles Associate with Kinesin-1 and Dynein
(A) Schematic diagram of a membrane flotation experiment showing the 8/35 fraction used as starting material for the vesicle immunoisolation in (B). Wild-type post-nuclear supernatant (PNS) obtained from wild-type mouse brain homogenate was bottom loaded. Buffers used did not contain detergent to prevent breaking of membranes. (B) An antibody against KLC1 was used to pull down associated membrane components from 8/35 fractions, including PrPC-containing vesicles. KHC antibody recognizes mostly Kinesin-1C. UNB = unbound fraction; imm = immunoisolation. Anti-GFP was used as a control. (C) Deconvolved images of vesicles stained with antibodies against PrPC and KLC1, Kinesin-1C, Kinesin-1A, or DHC1. Arrows point to some colocalization events. (D) Run length and (E) pause frequency in DHC1 shRNA axons. All values are shown as mean ± SEM. **p<0.01, *p<0.05, permutation t-test. (F) Segmental velocity histograms (shown as percent of segments) of YFP-PrPC transport in wild-type and DHC1 shRNA axons. Red and light blue curves represent the overall and predicted Gaussian modes, respectively. Ns = # segments; Nt = # tracks. See also Figure S2.
Figure 3. PrPC Vesicular Transport is Inhibited in Kinesin Light Chain Mutant Axons
(A) Representative kymograph of YFP-PrPC vesicle movement in wild-type (top panel), KLC1 -/- (middle panel), and KLC2 shRNA (bottom panel) hippocampal axons. (B-E) Transport parameters in KLC1 -/- and KLC2 shRNA axons. (B) Population breakdown of YFP-PrPC vesicles (Nv = # vesicles), (C) run length, (D) estimated run length, and (E) pause frequency. Numbers inside bars are segments (run length in C), and tracks (pause frequency in E). All values are shown as mean ± SEM. ***p<0.001, **p<0.01, *p<0.05, permutation t-test. (F) Segmental velocity histograms (shown in percent of segments) in wild-type, KLC1 -/-, and KLC2 shRNA axons. Red and light blue curves represent the overall and predicted Gaussian modes, respectively. (G) Anterograde and retrograde wild-type segmental velocity histograms (shown as percent of segments) were reconstituted from adding together histograms of KLC1 -/- and KLC2 shRNA axons (in F). See also Figure S3.
Figure 4. PrPC Vesicular Transport is Inhibited in Kinesin-1C Mutant Axons
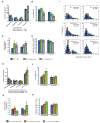
Transport parameters in Kinesin-1A -/-, Kinesin-1C -/-, and Kinesin-1B-cre axons. (A,E) Population breakdown of YFP-PrPC vesicles (Nv = # vesicles), (B, F) run length, (C, G) pause frequency, (D, H) segmental velocity. ***p<0.001, **p<0.01, *p<0.05, permutation t-test (black asterisks), Wilcoxon-Mann-Whitney test (red asterisks). Numbers inside bars are segments (run length in B and F, segmental velocity in D and H), and tracks (pause frequency in C and G). All values are shown as mean ± SEM. (I) Segmental velocity histograms (shown as percent of segments) in wild-type, Kinesin-1A -/-, and Kinesin-1C -/- axons. Red and light blue curves represent the overall and predicted Gaussian modes, respectively. See also Figure S4.
Figure 5. Composition of Motor Subunits on PrPC Vesicles
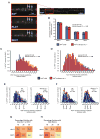
(A) Representative immunofluorescence image of a hippocampal axon stained with antibodies against PrPC, KLC1, and DHC1. Insets show enlargement with arrows pointing to three and two point sources in KLC1 and DHC1 channels, respectively, that associate with PrPC vesicles. Dots represent the location of fitted Gaussian functions. (B) Percentage of PrPC vesicles that have only KLC1, only DHC1, both, or no motor subunits associated with them. Inside bars are the numbers of vesicles for each category. All values are shown as mean ± SEM. (C-D) Gaussian intensity amplitude distributions comparing the frequency of PrPC vesicles associated with (C) DHC1 and (D) KLC1 intensities, in wild-type and Kinesin-1C -/- axons. (E-F) Histograms of the same Gaussian intensity amplitude distributions shown in (C, D), depicting percent of PrPC vesicles associated with (E) DHC1 and (F) KLC1. Red and light blue curves represent the overall and predicted Gaussian modes, respectively. Red open circles point to intersections between modes (G-H) Distribution of PrPC vesicles with (G) one or (H) both associated motor subunits. Numbers in boxes are percentages of PrPC vesicles in each category. Color gradient represents higher to lower percentage of PrPC vesicles in each category. Nv = # vesicles. See also Figure S5.
Figure 6. Association of Motor Subunits with Stationary and Moving YFP-PrPC Vesicles
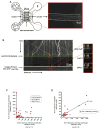
(A) Left panel: schematic diagram of a microfluidic chamber device. Transfected neurons are shown in green. Right panel: inset of two axons transfected with YFP-PrPC growing through a single microchannel (outlined with dotted lines) (B) Kymograph of YFP-PrPC movement in the wild-type hippocampal axon shown in (A). Time of paraformaldehyde application is indicated by green dotted line. The panel below the kymograph is of the deconvolved image of the same fixed axon showing the YFP-PrPC channel. Red squares correspond to the same anterograde-moving vesicles in the kymograph that have been mapped to those in the fixed deconvolved image. Deconvolved images (inset) were taken of all three fixed/stained channels. Point sources were fitted with Gaussian functions (colored dots). (C, D) Scatter plots of KLC1 versus DHC1 Gaussian intensity amplitudes of (C) all moving and stationary mapped vesicles from n = 7 axons (with and without associated motor subunits), and of (D) stationary vesicles with detected motor subunits.
Figure 7. A Stable Motor Association and Coordination Model of PrPC Vesicle Transport
(A) A stable motor subunit composition on anterograde, retrograde, or stationary vesicles is depicted, but only a subset of those are active to drive transport in either direction. Our data suggests a coordination model whereby Kinesin-1 and dynein act as alternating activators of opposite polarity transport. Number of motors depicted is arbitrary. See Discussion for details. (B) Activation of retrograde motility requires the vesicle association of a complete Kinesin-1 holoenzyme comprised of both KLC1 and Kinesin-1C. Removal of either subunit downregulates activation of DHC1, but does not dissociate DHC1 from PrPC vesicles. Thus, Kinesin-1C can activate DHC1 via interaction with KLC1.
Similar articles
- Kinesin-1, -2, and -3 motors use family-specific mechanochemical strategies to effectively compete with dynein during bidirectional transport.
Gicking AM, Ma TC, Feng Q, Jiang R, Badieyan S, Cianfrocco MA, Hancock WO. Gicking AM, et al. Elife. 2022 Sep 20;11:e82228. doi: 10.7554/eLife.82228. Elife. 2022. PMID: 36125250 Free PMC article. - Motor coordination via a tug-of-war mechanism drives bidirectional vesicle transport.
Hendricks AG, Perlson E, Ross JL, Schroeder HW 3rd, Tokito M, Holzbaur EL. Hendricks AG, et al. Curr Biol. 2010 Apr 27;20(8):697-702. doi: 10.1016/j.cub.2010.02.058. Epub 2010 Apr 15. Curr Biol. 2010. PMID: 20399099 Free PMC article. - Molecular motor function in axonal transport in vivo probed by genetic and computational analysis in Drosophila.
Reis GF, Yang G, Szpankowski L, Weaver C, Shah SB, Robinson JT, Hays TS, Danuser G, Goldstein LS. Reis GF, et al. Mol Biol Cell. 2012 May;23(9):1700-14. doi: 10.1091/mbc.E11-11-0938. Epub 2012 Mar 7. Mol Biol Cell. 2012. PMID: 22398725 Free PMC article. - Number of kinesins engaged in axonal cargo transport: A novel biomarker for neurological disorders.
Hayashi K, Sasaki K. Hayashi K, et al. Neurosci Res. 2023 Dec;197:25-30. doi: 10.1016/j.neures.2023.09.004. Epub 2023 Sep 19. Neurosci Res. 2023. PMID: 37734449 Review. - One axon, many kinesins: What's the logic?
Muresan V. Muresan V. J Neurocytol. 2000 Nov-Dec;29(11-12):799-818. doi: 10.1023/a:1010943424272. J Neurocytol. 2000. PMID: 11466472 Review.
Cited by
- Subpixel colocalization reveals amyloid precursor protein-dependent kinesin-1 and dynein association with axonal vesicles.
Szpankowski L, Encalada SE, Goldstein LS. Szpankowski L, et al. Proc Natl Acad Sci U S A. 2012 May 29;109(22):8582-7. doi: 10.1073/pnas.1120510109. Epub 2012 May 11. Proc Natl Acad Sci U S A. 2012. PMID: 22582169 Free PMC article. - Coil-to-α-helix transition at the Nup358-BicD2 interface activates BicD2 for dynein recruitment.
Gibson JM, Cui H, Ali MY, Zhao X, Debler EW, Zhao J, Trybus KM, Solmaz SR, Wang C. Gibson JM, et al. Elife. 2022 Mar 1;11:e74714. doi: 10.7554/eLife.74714. Elife. 2022. PMID: 35229716 Free PMC article. - Kinesin and dynein use distinct mechanisms to bypass obstacles.
Ferro LS, Can S, Turner MA, ElShenawy MM, Yildiz A. Ferro LS, et al. Elife. 2019 Sep 9;8:e48629. doi: 10.7554/eLife.48629. Elife. 2019. PMID: 31498080 Free PMC article. - Tau/MAPT disease-associated variant A152T alters tau function and toxicity via impaired retrograde axonal transport.
Butler VJ, Salazar DA, Soriano-Castell D, Alves-Ferreira M, Dennissen FJA, Vohra M, Oses-Prieto JA, Li KH, Wang AL, Jing B, Li B, Groisman A, Gutierrez E, Mooney S, Burlingame AL, Ashrafi K, Mandelkow EM, Encalada SE, Kao AW. Butler VJ, et al. Hum Mol Genet. 2019 May 1;28(9):1498-1514. doi: 10.1093/hmg/ddy442. Hum Mol Genet. 2019. PMID: 30590647 Free PMC article. - Spatial and temporal characteristics of normal and perturbed vesicle transport.
Iacobucci GJ, Rahman NA, Valtueña AA, Nayak TK, Gunawardena S. Iacobucci GJ, et al. PLoS One. 2014 May 30;9(5):e97237. doi: 10.1371/journal.pone.0097237. eCollection 2014. PLoS One. 2014. PMID: 24878565 Free PMC article.
References
- Borchelt DR, Davis J, Fischer M, Lee MK, Slunt HH, Ratovitsky T, Regard J, Copeland NG, Jenkins NA, Sisodia SS, et al. A vector for expressing foreign genes in the brains and hearts of transgenic mice. Genet Anal. 1996;13:159–163. - PubMed
- Borchelt DR, Koliatsos VE, Guarnieri M, Pardo CA, Sisodia SS, Price DL. Rapid anterograde axonal transport of the cellular prion glycoprotein in the peripheral and central nervous systems. J Biol Chem. 1994;269:14711–14714. - PubMed
Publication types
MeSH terms
Substances
Grants and funding
- T32 GM008806/GM/NIGMS NIH HHS/United States
- R01 AG032180/AG/NIA NIH HHS/United States
- P30 NS047101/NS/NINDS NIH HHS/United States
- AG032180/AG/NIA NIH HHS/United States
- T32 AG000216/AG/NIA NIH HHS/United States
- AG000216/AG/NIA NIH HHS/United States
LinkOut - more resources
Full Text Sources
Other Literature Sources
Molecular Biology Databases
Research Materials


