Environmental and antigen receptor-derived signals support sustained surveillance of the lungs by pathogen-specific cytotoxic T lymphocytes - PubMed (original) (raw)
Environmental and antigen receptor-derived signals support sustained surveillance of the lungs by pathogen-specific cytotoxic T lymphocytes
Young-Tae Lee et al. J Virol. 2011 May.
Abstract
Viral infections often gain access to the body of their host by exploiting areas of natural vulnerability, such as the semipermeable surfaces of mucosal tissues which are adapted for adsorption of nutrients and other diffusible molecules. Once the microbes have crossed the epithelial barrier, they can disperse to other tissues where eradication may not be possible. The best opportunity for successful immune intervention is immediately after infection while the pathogen is confined to a localized area of the body. Cytotoxic T lymphocytes (CTL) which reside at the site where the infection begins can make an important contribution to immunity by reducing early dissemination of the infection. Because the lungs provide easy access points for many pathogens to enter the body, they require protection from many complementary mechanisms, including pathogen-specific cytotoxic T cells. In this study we show that an enduring response to pathogen-derived peptide antigens facilitates sustained surveillance of the lungs by pathogen-specific CTL during the recovery from influenza virus infection. Our studies show that these processed peptide antigens reinforce expression of two homing receptors (CD69 and CD103) which help recently activated virus-specific CTL colonize the lungs during a mild inflammatory response. We suggest that this requirement for prolonged antigen presentation to reinforce local CTL responses in the lungs explains why protective cellular immunity quickly declines following influenza virus infection and other viral infections that enter the body via mucosal tissues.
Figures
Fig. 1.
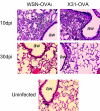
Inflammation in lungs declines after viral clearance. Mice were infected with WSN-OVAI or X31-OVA. The lungs were harvested from groups of three animals at either 10 dpi, which is the peak of CD8 effector response, or 30 dpi, when very few activated granulocytes remained. The lungs were inflated with 4% formaldehyde and fixed for 1 h. The lung tissues were embedded in paraffin, and 4-μm sections were stained with hematoxylin and eosin. Photographs were taken at a magnification of ×10 (aw, airway). Tissues from representative animals are shown.
Fig. 2.
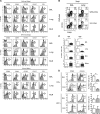
Antigen is required for sustained CD69 and CD103 expression on CD8 T cells in the lungs. Recipient B6 mice were infected with WSN-OVAI or X31-OVA. (A) MHC-I tetramer analysis was used to phenotype the virus-specific CD8 T cells in the lungs at 30 dpi. Overlaid histograms (representative animals from groups of five) show gated populations of tetramer-positive CD8 T cells from X31-OVA-infected mice (gray shading) and WSN-OVAI-infected mice (dashed line). The percentages of cells that were found within the markers (averages from five animals) are shown for WSN-OVAI-infected (above the line) and X31-OVA-infected (below the line) animals. Statistical significance was determined using an unpaired Student's t test. Three independent experiments gave very similar results. (B) Large percentages of OVA-specific CD8 T cells in the lungs expressed both CD69 and CD103 30 days after WSN-OVAI infection. (C) Different numbers of OVA-specific CD8 T cells were recovered at 30 dpi from the lungs of the X31-OVA-infected mice and WSN-OVAI-infected animals. Means ± standard deviations from three individual animals are shown. (D) WSN-OVAI-infected mice were treated twice with 25D1.16 (or isotype control) antibodies at 20 and 23 dpi. MHC-I tetramer analysis was used to phenotype virus-specific CD8 T cells in the lungs 6 days later. Overlaid histograms (representative animals from groups of three) show tetramer-positive cells within the CD8 gate. The percentages of cells within the marked regions (averages from three animals) are shown for 25D1.16-treated mice (below the marker and gray shading) and control animals (above the marker and dashed lines). Two independent experiments gave very similar results. Bar charts are means ± standard deviations of OVA-specific CD8 T cells from three individual animals. Max, maximum; tet, tetracycline; BAL, bronchoalveolar lavage specimen. *, P < 0.05; **, P < 0.01; ***, P < 0.001.
Fig. 3.
CD69 is required for efficient CD8 T cell migration to the lungs. Equal numbers (106) of F5-WT and F5-CD69KO cells were transferred to B6 mice 1 day before E61-13-H17 infection. On the days shown the recipient mice were analyzed for ratios of transferred F5 cells using the congenic CD45.1 and CD45.2 markers. The bar graphs show percentages (with standard deviations) of mutant and WT F5 cells within the CD45.1 gate from three animals. The histograms show gated populations of transferred F5 cells from representative animals, with percentages of cells in marked regions (averaged from groups of three). Three independent experiments gave very similar results. *, P < 0.05; **, P < 0.01; ***, P < 0.001.
Fig. 4.
CD103 promotes CD8 T cell retention in the lungs. Equal numbers (106) of RAG−/− OTI-WT and OTI-CD103KO cells were transferred to B6 mice 24 h before they were infected with WSN-OVAI. On the days shown, the recipient mice were analyzed for ratios of transferred OTI cells using the congenic CD45.1 and CD45.2 markers. The bar graphs show percentages (with standard deviations) of mutant and WT OTI cells within the CD45.1 gate from three individual animals. The histograms show gated populations of transferred F5 cells from representative animals, with percentages of cells in marked regions (averaged from groups of three individual animals). Three independent experiments gave very similar results. *, P < 0.05; **, P < 0.01; ***, P < 0.001.
Fig. 5.
TGF-β supports a lung-homing phenotype for virus-specific CD8 T cells. Equal numbers of F5-WT and F5-dnTGFβRII cells (A) or F5-WT and F5-dnTGFβRII-CD69KO cells (B) were transferred to B6 mice 1 day before infection with E61-13-H17. Recipient mice were analyzed for ratios of transferred F5 cells at 9 dpi using the congenic CD45.1 and CD45.2 markers. Overlaid histograms show gated populations of transferred F5 cells. Means ± standard deviations from three individual animals are shown. Duplicate experiments gave similar results. *, P < 0.05; **, P < 0.01; ***, P < 0.001.
Similar articles
- Tissue Distribution of Memory T and B Cells in Rhesus Monkeys following Influenza A Infection.
Pichyangkul S, Yongvanitchit K, Limsalakpetch A, Kum-Arb U, Im-Erbsin R, Boonnak K, Thitithayanont A, Jongkaewwattana A, Wiboon-ut S, Mongkolsirichaikul D, Mahanonda R, Spring M, Chuang I, Mason CJ, Saunders DL. Pichyangkul S, et al. J Immunol. 2015 Nov 1;195(9):4378-86. doi: 10.4049/jimmunol.1501702. Epub 2015 Sep 25. J Immunol. 2015. PMID: 26408671 Free PMC article. - Division of labor between subsets of lymph node dendritic cells determines the specificity of the CD8⁺ T-cell recall response to influenza infection.
Suárez-Ramírez JE, Wu T, Lee YT, Aguila CC, Bouchard KR, Cauley LS. Suárez-Ramírez JE, et al. Eur J Immunol. 2011 Sep;41(9):2632-41. doi: 10.1002/eji.201141546. Epub 2011 Aug 18. Eur J Immunol. 2011. PMID: 21660939 Free PMC article. - Immunity to Respiratory Infection Is Reinforced Through Early Proliferation of Lymphoid TRM Cells and Prompt Arrival of Effector CD8 T Cells in the Lungs.
Suarez-Ramirez JE, Chandiran K, Brocke S, Cauley LS. Suarez-Ramirez JE, et al. Front Immunol. 2019 Jun 14;10:1370. doi: 10.3389/fimmu.2019.01370. eCollection 2019. Front Immunol. 2019. PMID: 31258537 Free PMC article. - Lung CD103+ dendritic cells efficiently transport influenza virus to the lymph node and load viral antigen onto MHC class I for presentation to CD8 T cells.
Ho AW, Prabhu N, Betts RJ, Ge MQ, Dai X, Hutchinson PE, Lew FC, Wong KL, Hanson BJ, Macary PA, Kemeny DM. Ho AW, et al. J Immunol. 2011 Dec 1;187(11):6011-21. doi: 10.4049/jimmunol.1100987. Epub 2011 Oct 31. J Immunol. 2011. PMID: 22043017 - Gamma interferon is not required for mucosal cytotoxic T-lymphocyte responses or heterosubtypic immunity to influenza A virus infection in mice.
Nguyen HH, van Ginkel FW, Vu HL, Novak MJ, McGhee JR, Mestecky J. Nguyen HH, et al. J Virol. 2000 Jun;74(12):5495-501. doi: 10.1128/jvi.74.12.5495-5501.2000. J Virol. 2000. PMID: 10823854 Free PMC article.
Cited by
- Tissue resident memory T cells- A new benchmark for the induction of vaccine-induced mucosal immunity.
Hassert M, Harty JT. Hassert M, et al. Front Immunol. 2022 Oct 4;13:1039194. doi: 10.3389/fimmu.2022.1039194. eCollection 2022. Front Immunol. 2022. PMID: 36275668 Free PMC article. Review. - CD8+ Tissue-Resident Memory T Cells: Versatile Guardians of the Tissue.
Marchesini Tovar G, Gallen C, Bergsbaken T. Marchesini Tovar G, et al. J Immunol. 2024 Feb 1;212(3):361-368. doi: 10.4049/jimmunol.2300399. J Immunol. 2024. PMID: 38227907 - Lymphoid tissue residency: A key to understand Tcf-1+PD-1+ T cells.
Ma C, Zhang N. Ma C, et al. Front Immunol. 2022 Dec 7;13:1074698. doi: 10.3389/fimmu.2022.1074698. eCollection 2022. Front Immunol. 2022. PMID: 36569850 Free PMC article. Review. - Spontaneous Proliferation of CD4+ T Cells in RAG-Deficient Hosts Promotes Antigen-Independent but IL-2-Dependent Strong Proliferative Response of Naïve CD8+ T Cells.
Kim J, Lee JY, Cho K, Hong SW, Kim KS, Sprent J, Im SH, Surh CD, Cho JH. Kim J, et al. Front Immunol. 2018 Aug 23;9:1907. doi: 10.3389/fimmu.2018.01907. eCollection 2018. Front Immunol. 2018. PMID: 30190718 Free PMC article. - CD8+ Resident Memory T Cells and Viral Infection.
Wu X, Wu P, Shen Y, Jiang X, Xu F. Wu X, et al. Front Immunol. 2018 Sep 19;9:2093. doi: 10.3389/fimmu.2018.02093. eCollection 2018. Front Immunol. 2018. PMID: 30283442 Free PMC article. Review.
References
- Belyakov I. M., Ahlers J. D. 2009. What role does the route of immunization play in the generation of protective immunity against mucosal pathogens? J. Immunol. 183:6883–6892 - PubMed
- Craston R., et al. 1997. Temporal dynamics of CD69 expression on lymphoid cells. J. Immunol. Methods 209:37–45 - PubMed
- Deblandre G. A., Leo O., Huez G. A., Wathelet M. G. 1992. CD69 is expressed on Daudi cells in response to interferon-alpha. Cytokine 4:36–43 - PubMed
Publication types
MeSH terms
Substances
Grants and funding
- R01 AI071213/AI/NIAID NIH HHS/United States
- P01 AI056172/AI/NIAID NIH HHS/United States
- R01 AI-36532/AI/NIAID NIH HHS/United States
- AI056172/AI/NIAID NIH HHS/United States
- AI071213/AI/NIAID NIH HHS/United States
- R01 AI036532/AI/NIAID NIH HHS/United States
LinkOut - more resources
Full Text Sources
Molecular Biology Databases
Research Materials


