Interaction of ASIC1 and ENaC subunits in human glioma cells and rat astrocytes - PubMed (original) (raw)
Interaction of ASIC1 and ENaC subunits in human glioma cells and rat astrocytes
Niren Kapoor et al. Am J Physiol Cell Physiol. 2011 Jun.
Abstract
Glioblastoma multiforme (GBM) is the most common and aggressive of the primary brain tumors. These tumors express multiple members of the epithelial sodium channel (ENaC)/degenerin (Deg) family and are associated with a basally active amiloride-sensitive cation current. We hypothesize that this glioma current is mediated by a hybrid channel composed of a mixture of ENaC and acid-sensing ion channel (ASIC) subunits. To test the hypothesis that ASIC1 interacts with αENaC and γENaC at the cellular level, we have used total internal reflection fluorescence microscopy (TIRFM) in live rat astrocytes transiently cotransfected with cDNAs for ASIC1-DsRed plus αENaC-yellow fluorescent protein (YFP) or ASIC1-DsRed plus γENaC-YFP. TIRFM images show colocalization of ASIC1 with both αENaC and γENaC. Furthermore, using TIRFM in stably transfected D54-MG cells, we also found that ASIC1 and αENaC both localize to a submembrane region following exposure to pH 6.0, similar to the acidic conditions found in the core of a glioblastoma lesion. Using high-resolution clear native gel electrophoresis, we found that ASIC1 forms a complex with ENaC subunits which migrates at ≈480 kDa in D54-MG glioma cells. These data suggest that different ENaC/Deg subunits interact and could combine to form a hybrid channel that likely underlies the amiloride-sensitive current seen in human glioma cells.
Figures
Fig. 1.
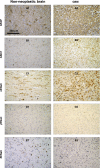
Immunhistochemical staining of acid-sensing ion channel 1 (ASIC1) and epithelium sodium channel (ENaC) subunits in glioblastoma biopsy tissue and non-neoplastic brain tissue. Representative images of human non-neoplastic brain tissue (left) and glioblastoma multiforme (GBM) biopsy tissue (right) stained with antibodies against glial fibrillary acidic protein (GFAP) (A1 and A2), ASIC1 (B1 and B2), and αENaC (C1 and C2) qualitatively show apparent higher staining in GBM tissue compared with non-neoplastic brain tissue. Staining for γENaC (D1 and D2) showed a slight increase in GBM tissue compared with non-neoplastic brain tissue, whereas non-neoplastic brain tissue showed a slightly more intense staining for δENaC expression than GBM tissue (E1 and E2). n ≥ 3 for each condition. Scale bar is 200 μm.
Fig. 2.
Relative mRNA and protein levels from primary glioblastoma cells and primary human astrocytes. Average relative mRNA expression for different ENaC/degenerin (Deg) subunits proportional to 18S RNA were measured in primary GBM cells and primary human astrocytes using RT-PCR. A significantly higher mRNA expression for ASIC1 (A) and αENaC (D) was seen in GBM cells compared with primary astrocytes. Expression of γENaC mRNA (G) was also higher but not significantly increased in GBM cells compared with primary human astrocytes (n = 6 experiments run in duplicate). B and C: corresponding ASIC1 protein level in primary human astrocytes and primary GBM cells using Western blot analysis (n = 7). E and F: αENaC protein levels (n = 6). H and I: γENaC protein levels (n = 6). Western blot data were normalized for the density of the corresponding actin band and then normalized to the density of the band for the normal astrocyte sample no. 1009. Error bars ± SD. *P < 0.05.
Fig. 3.
Colocalization of ASIC1 and ENaC subunits in rat astrocytes. A: primary rat astrocytes cotransfected with ASIC1-DsRed and αENaC-yellow fluorescent protein (YFP) were imaged using total internal reflection fluorescent microscopy (TIRFM). Images of αENaC-YFP (left) and ASIC1-DsRed (middle) were merged postacquisition (right). B: primary rat astrocytes cotransfected and expressing γENaC-YFP (left) and ASIC1-DsRed (middle); merged TIRFM image (right). Both TIRFM merged images in A and B show a colocalization of ASIC1 with αENaC and γENaC, respectively. n = 14–22 for different conditions. C: epifluorescence (EPI) images, from the same cell as shown in B, display the perinuclear and ER/Golgi staining, which is not seen in the TIRFM images.
Fig. 4.
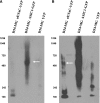
ASIC and ENaC are a part of a large 480-kDa complex in D54-MG glioma cells. Solubilized lysates from D54-MG glioma cells stably transfected with either ASIC1-GFP, αENaC-YFP, or eYFP were run on an 8–13% Tris-acetate gel under native conditions (high resolution clear native electrophoresis). Proteins were transferred onto a PVDF membrane and blotted using a green fluorescent protein (GFP)/YFP antibody. A and B: images of the same blot at 10 and 60 s exposure, respectively. Presence of a distinct band at 480 kDa (white arrows) in both ASIC1-GFP- and αENaC-YFP-transfected cells but its absence in eYFP-transfected cells suggest the presence of a large ASIC-ENaC channel complex of ≈480 kDa in D54-MG glioma cells. NativeMark Unstained Protein Standard (Invitrogen) was used as protein molecular weight marker (numbers in the columns left to the gels). This blot is representative of three similar immunoblots.
Fig. 5.
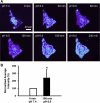
Exposure to low pHo causes a redistribution of ASIC1-GFP in stably expressing D54-MG glioma cells. Live D54-MG cells stably expressing ASIC1-GFP were imaged using TIRFM in the presence of external solution at pH 7.4 or external solution at pH 6.0. A change in the intensity of GFP signal indicated a change in the localization of ASIC1-GFP. A: representative images of cells at pH 7.4 illustrating little change in the intensity of GFP fluorescence over time. GFP intensity range (linear pseudocolor): 115–1,500 intensity units. Insets show corresponding epifluorescence images, albeit reduced (37%) in size. B: reducing the pH of external solution from 7.4 to 6.0 increased the GFP intensity in D54-MG glioma cells. GFP pseudocolor intensity range and insets as in A. C: quantitative plot showing the average normalized GFP intensity for each condition at pH 7.4 and pH 6.0 (normalized to the initial condition at 0 min and pH 7.4) showing a significant increase in GFP intensity when the pH of the external solution was reduced. Data were tested using Student's _t_-test. Error bars ± SD, *P < 0.05. n = 3 for 7.4/7.4 pair and 5 for 6.0/7.4 pair.
Fig. 6.
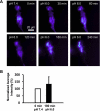
Low pHo does not affect the intracellular distribution of ClC1-YFP in D54-MG glioma cells. A: live D54-MG cells transiently transfected with ClC1-YFP were imaged using the protocol as described for Fig. 5. Representative images showing changes in YFP signal intensity at 0, 30, 60, 120, 180, and 240 min after exchanging the bath solution from pH 7.4 to 6.0. YFP intensity range (linear pseudocolor): 115–500 intensity units. B: there is no significant difference in the intensity of ClC1-YFP 180 min after reducing the pH of external solution from 7.4 (0 min) to 6.0 (other time points). YFP signal for each cell at pH 6.0 was normalized to the corresponding signal at pH 7.4. Data were tested using Student's _t_-test. Error bars ± SD and n = 5.
Fig. 7.
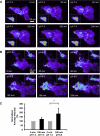
Exposure to low pHo causes a redistribution of αENaC in stably expressing D54-MG glioma cells. Live D54-MG cells stably expressing αENaC-YFP were imaged using TIRFM. A: representative time-lapse images showing changes in YFP signal intensity at 0, 30, 60, 120, 180, and 240 min after exchanging the bath solution from pH 7.4 (0 min) to 6.0 (other time points). YFP intensity range (linear pseudocolor): 104–505 intensity units. B: quantitative analysis for average YFP intensity from cells at rest (0 min, pH 7.4) and then after incubation for 180 min at pH 6.0. The data are normalized to the YFP intensity obtained at pH 7.4 (0 min). Data were tested using Student's _t_-test. Error bars ± SD, *P < 0.05 and n = 5.
Fig. 8.
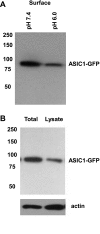
Exposure to low pHo leads to reduced surface/plasma membrane and total ASIC-EGFP protein expression in D54-MG glioma cells. A: Western blots after surface biotinylation of cells stably expressing ASIC1-GFP cells during a 4-h incubation in extracellular solution with pH 7.4 or pH 6.0. B: Western blots showing the total expression of ASIC1-GFP. Immunoblots were developed with an antibody against GFP. Actin was used as a loading control. Numbers on left indicate protein molecular weight markers.
Fig. 9.
Effect of low pHo on glioma cell amiloride-sensitive current. A: bar plots showing perforated patch-clamp current at −80 mV in D54-MG ASIC1-GFP glioma cells after 4 h incubation at pH 7.4 and pH 6.0 showing basal current. Significant inhibition in the current is seen in both the groups after application of 100 μM amiloride. B: percent inhibition of the current after application of 100 μM amiloride to the bath solution. C: current-voltage plots for experiments in A. Data were tested by Student's _t_-test. Error bars ± SE and *P < 0.05. n = 8 for pH 7.4 group, and n = 7 for pH 6.0 group.
Similar articles
- Knockdown of ASIC1 and epithelial sodium channel subunits inhibits glioblastoma whole cell current and cell migration.
Kapoor N, Bartoszewski R, Qadri YJ, Bebok Z, Bubien JK, Fuller CM, Benos DJ. Kapoor N, et al. J Biol Chem. 2009 Sep 4;284(36):24526-41. doi: 10.1074/jbc.M109.037390. Epub 2009 Jun 26. J Biol Chem. 2009. PMID: 19561078 Free PMC article. - Proteolytic cleavage of human acid-sensing ion channel 1 by the serine protease matriptase.
Clark EB, Jovov B, Rooj AK, Fuller CM, Benos DJ. Clark EB, et al. J Biol Chem. 2010 Aug 27;285(35):27130-27143. doi: 10.1074/jbc.M110.153213. Epub 2010 Jul 2. J Biol Chem. 2010. PMID: 20601429 Free PMC article. - Glioma-specific cation conductance regulates migration and cell cycle progression.
Rooj AK, McNicholas CM, Bartoszewski R, Bebok Z, Benos DJ, Fuller CM. Rooj AK, et al. J Biol Chem. 2012 Feb 3;287(6):4053-65. doi: 10.1074/jbc.M111.311688. Epub 2011 Nov 30. J Biol Chem. 2012. PMID: 22130665 Free PMC article. - Insight toward epithelial Na+ channel mechanism revealed by the acid-sensing ion channel 1 structure.
Stockand JD, Staruschenko A, Pochynyuk O, Booth RE, Silverthorn DU. Stockand JD, et al. IUBMB Life. 2008 Sep;60(9):620-8. doi: 10.1002/iub.89. IUBMB Life. 2008. PMID: 18459164 Review. - ASIC and ENaC type sodium channels: conformational states and the structures of the ion selectivity filters.
Hanukoglu I. Hanukoglu I. FEBS J. 2017 Feb;284(4):525-545. doi: 10.1111/febs.13840. Epub 2016 Sep 15. FEBS J. 2017. PMID: 27580245 Review.
Cited by
- Epithelial Na + Channels Function as Extracellular Sensors.
Kashlan OB, Wang XP, Sheng S, Kleyman TR. Kashlan OB, et al. Compr Physiol. 2024 Mar 29;14(2):1-41. doi: 10.1002/cphy.c230015. Compr Physiol. 2024. PMID: 39109974 Review. - Molecular Basis for Mambalgin-2 Interaction with Heterotrimeric α-ENaC/ASIC1a/γ-ENaC Channels in Cancer Cells.
Lyukmanova EN, Zaigraev MM, Kulbatskii DS, Isaev AB, Kukushkin ID, Bychkov ML, Shulepko MA, Chugunov AO, Kirpichnikov MP. Lyukmanova EN, et al. Toxins (Basel). 2023 Oct 13;15(10):612. doi: 10.3390/toxins15100612. Toxins (Basel). 2023. PMID: 37888643 Free PMC article. - Neurotoxin-Derived Optical Probes for Biological and Medical Imaging.
Ergen PH, Shorter S, Ntziachristos V, Ovsepian SV. Ergen PH, et al. Mol Imaging Biol. 2023 Oct;25(5):799-814. doi: 10.1007/s11307-023-01838-1. Epub 2023 Jul 19. Mol Imaging Biol. 2023. PMID: 37468801 Free PMC article. Review. - Ion Channels in Gliomas-From Molecular Basis to Treatment.
Elias AF, Lin BC, Piggott BJ. Elias AF, et al. Int J Mol Sci. 2023 Jan 28;24(3):2530. doi: 10.3390/ijms24032530. Int J Mol Sci. 2023. PMID: 36768856 Free PMC article. Review. - Mambalgin-2 Inhibits Lung Adenocarcinoma Growth and Migration by Selective Interaction With ASIC1/α-ENaC/γ-ENaC Heterotrimer.
Sudarikova AV, Bychkov ML, Kulbatskii DS, Chubinskiy-Nadezhdin VI, Shlepova OV, Shulepko MA, Koshelev SG, Kirpichnikov MP, Lyukmanova EN. Sudarikova AV, et al. Front Oncol. 2022 Jun 28;12:904742. doi: 10.3389/fonc.2022.904742. eCollection 2022. Front Oncol. 2022. PMID: 35837090 Free PMC article.
References
- Akaike N, Harata N. Nystatin perforated patch recording and its applications to analyses of intracellular mechanisms. Jap J Physiol 44: 433–473, 1994 - PubMed
- Ambudkar IS. Trafficking of TRP channels: determinants of channel function. Handbook Exp Pharmacol 541–557, 2007 - PubMed
- Babini E, Geisler HS, Siba M, Grunder S. A new subunit of the epithelial Na+ channel identifies regions involved in Na+ self-inhibition. J Biol Chem 278: 28418–28426, 2003 - PubMed
Publication types
MeSH terms
Substances
Grants and funding
- NS-47466/NS/NINDS NIH HHS/United States
- P30 NS057098/NS/NINDS NIH HHS/United States
- R01 DK037206/DK/NIDDK NIH HHS/United States
- DK-37206/DK/NIDDK NIH HHS/United States
- NS-57098/NS/NINDS NIH HHS/United States
- R01 MH069791/MH/NIMH NIH HHS/United States
- CA 101952/CA/NCI NIH HHS/United States
- P30 NS047466/NS/NINDS NIH HHS/United States
- MH-069791/MH/NIMH NIH HHS/United States
LinkOut - more resources
Full Text Sources
Medical
