Systematic evaluation of three microRNA profiling platforms: microarray, beads array, and quantitative real-time PCR array - PubMed (original) (raw)
Systematic evaluation of three microRNA profiling platforms: microarray, beads array, and quantitative real-time PCR array
Bin Wang et al. PLoS One. 2011.
Abstract
Background: A number of gene-profiling methodologies have been applied to microRNA research. The diversity of the platforms and analytical methods makes the comparison and integration of cross-platform microRNA profiling data challenging. In this study, we systematically analyze three representative microRNA profiling platforms: Locked Nucleic Acid (LNA) microarray, beads array, and TaqMan quantitative real-time PCR Low Density Array (TLDA).
Methodology/principal findings: The microRNA profiles of 40 human osteosarcoma xenograft samples were generated by LNA array, beads array, and TLDA. Results show that each of the three platforms perform similarly regarding intra-platform reproducibility or reproducibility of data within one platform while LNA array and TLDA had the best inter-platform reproducibility or reproducibility of data across platforms. The endogenous controls/probes contained in each platform have been observed for their stability under different treatments/environments; those included in TLDA have the best performance with minimal coefficients of variation. Importantly, we identify that the proper selection of normalization methods is critical for improving the inter-platform reproducibility, which is evidenced by the application of two non-linear normalization methods (loess and quantile) that substantially elevated the sensitivity and specificity of the statistical data assessment.
Conclusions: Each platform is relatively stable in terms of its own microRNA profiling intra-reproducibility; however, the inter-platform reproducibility among different platforms is low. More microRNA specific normalization methods are in demand for cross-platform microRNA microarray data integration and comparison, which will improve the reproducibility and consistency between platforms.
Conflict of interest statement
Competing Interests: The authors have declared that no competing interests exist.
Figures
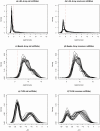
Figure 1. Expression distributions of miRNAs being profiled by the three platforms.
Plots (a), (c) and (e) demonstrate the density curves of the expression of all miRNAs being profiled by LNA array, beads array, and TLDA, respectively. Plots (b), (d) and (f) compare the density curves of the expressions of the overlapped miRNAs from all three platforms. We took a log2 transformation to all intensity measures. For TLDA data, the  values were used.
Figure 2. Signal-to-noise ratio comparison between beads array and LNA array.
Plot (a) shows the density curves of the log signal-to-noise ratios for different samples tested by beads array, while the results for LNA array are demonstrated in plot (b). A log signal-to-noise ratio close to “one” indicates that the signal after background subtraction is close to the background noise.
Figure 3. Intra- and inter-platform reproducibility comparisons.
The first box plot to the left is based on Spearman's correlation coefficients between the LNA profiles of any two samples under the same treatment. The second and third plots are for the beads array and TLDA, respectively. The fourth plot is constructed based on the Spearman's correlation coefficients between the two profiles obtained by beads array and LNA array based on the same sample under the same treatment for all 10 samples. The fifth plot shows the results between beads array and TLDA, while the sixth plot shows the results between LNA array and TLDA.
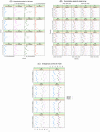
Figure 4. Comparison of three platforms' miRNA profiling data.
(A) LNA array: The expressions of the four normalization probes in each LNA array are plotted, which have similar patterns across 10 samples under the four different treatments. (B) Beads array: The expressions of the four normalization beads in the five pools while testing 40 different samples are compared, which have similar patterns in the five pools across samples and indicate that these transcripts do not express significant variation between pools and samples. (C) TLDA: The profiles of the three endogenous controls commonly used by TLDA Cards A and B are demonstrated relatively stable across samples and treatments. Ctrl, Cis, Dox, and Ifo represent control, and three different chemo drug treatments.
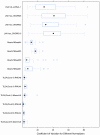
Figure 5. Stability evaluation for endogenous controls/probes from three platforms.
The box plots of coefficient of variation (CV) values for each projected normalizer are calculated by using the measures of the replicates. Ctrl, Cis, Dox, and Ifo represent control, and three different chemo drug treatments.
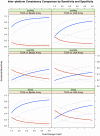
Figure 6. Inter-platform reproducibility measured by sensitivity and specificity.
Sensitivities were compared to evaluate the consistency among the three platforms. The three plots in the first column compare the consistency between beads array and TLDA, the three plots in the second column compare the consistency between LNA array and TLDA, and the plots in the third column compare the consistency between beads array and LNA array. The results in the first, second and third rows are based on the profiles normalized using scaling by specific controls/probes, quantile normalization, and the cyclic loess method, respectively.
Similar articles
- Testing for differentially-expressed microRNAs with errors-in-variables nonparametric regression.
Wang B, Zhang SG, Wang XF, Tan M, Xi Y. Wang B, et al. PLoS One. 2012;7(5):e37537. doi: 10.1371/journal.pone.0037537. Epub 2012 May 24. PLoS One. 2012. PMID: 22655055 Free PMC article. - Intra-platform repeatability and inter-platform comparability of microRNA microarray technology.
Sato F, Tsuchiya S, Terasawa K, Tsujimoto G. Sato F, et al. PLoS One. 2009;4(5):e5540. doi: 10.1371/journal.pone.0005540. Epub 2009 May 14. PLoS One. 2009. PMID: 19436744 Free PMC article. - Comparison of microarray platforms for measuring differential microRNA expression in paired normal/cancer colon tissues.
Callari M, Dugo M, Musella V, Marchesi E, Chiorino G, Grand MM, Pierotti MA, Daidone MG, Canevari S, De Cecco L. Callari M, et al. PLoS One. 2012;7(9):e45105. doi: 10.1371/journal.pone.0045105. Epub 2012 Sep 13. PLoS One. 2012. PMID: 23028787 Free PMC article. - Data Normalization Strategies for MicroRNA Quantification.
Schwarzenbach H, da Silva AM, Calin G, Pantel K. Schwarzenbach H, et al. Clin Chem. 2015 Nov;61(11):1333-42. doi: 10.1373/clinchem.2015.239459. Epub 2015 Sep 25. Clin Chem. 2015. PMID: 26408530 Free PMC article. Review. - Expression profiling of microRNA using real-time quantitative PCR, how to use it and what is available.
Benes V, Castoldi M. Benes V, et al. Methods. 2010 Apr;50(4):244-9. doi: 10.1016/j.ymeth.2010.01.026. Epub 2010 Jan 28. Methods. 2010. PMID: 20109550 Review.
Cited by
- Testing for differentially-expressed microRNAs with errors-in-variables nonparametric regression.
Wang B, Zhang SG, Wang XF, Tan M, Xi Y. Wang B, et al. PLoS One. 2012;7(5):e37537. doi: 10.1371/journal.pone.0037537. Epub 2012 May 24. PLoS One. 2012. PMID: 22655055 Free PMC article. - MicroRNAs as lung cancer biomarkers.
Del Vescovo V, Grasso M, Barbareschi M, Denti MA. Del Vescovo V, et al. World J Clin Oncol. 2014 Oct 10;5(4):604-20. doi: 10.5306/wjco.v5.i4.604. World J Clin Oncol. 2014. PMID: 25302165 Free PMC article. Review. - Tissue microRNAs in non-small cell lung cancer detected with a new kind of liquid bead array detection system.
Zheng YY, Fei Y, Wang Z, Chen Y, Qiu C, Li FR. Zheng YY, et al. J Transl Med. 2020 Mar 2;18(1):108. doi: 10.1186/s12967-020-02280-5. J Transl Med. 2020. PMID: 32122370 Free PMC article. - Down-Regulation of miR-129-5p and the let-7 Family in Neuroendocrine Tumors and Metastases Leads to Up-Regulation of Their Targets Egr1, G3bp1, Hmga2 and Bach1.
Døssing KB, Binderup T, Kaczkowski B, Jacobsen A, Rossing M, Winther O, Federspiel B, Knigge U, Kjær A, Friis-Hansen L. Døssing KB, et al. Genes (Basel). 2014 Dec 24;6(1):1-21. doi: 10.3390/genes6010001. Genes (Basel). 2014. PMID: 25546138 Free PMC article. - Profound effect of profiling platform and normalization strategy on detection of differentially expressed microRNAs--a comparative study.
Meyer SU, Kaiser S, Wagner C, Thirion C, Pfaffl MW. Meyer SU, et al. PLoS One. 2012;7(6):e38946. doi: 10.1371/journal.pone.0038946. Epub 2012 Jun 18. PLoS One. 2012. PMID: 22723911 Free PMC article.
References
- Lewis BP, Burge CB, Bartel DP. Conserved seed pairing, often flanked by adenosines, indicates that thousands of human genes are microRNA targets. Cell. 2005;120:15–20. - PubMed
- Carmell MA, Xuan Z, Zhang MQ, Hannon GJ. The Argonaute family: tentacles that reach into RNAi, developmental control, stem cell maintenance, and tumorigenesis. Genes Dev. 2002;16:2733–2742. - PubMed
Publication types
MeSH terms
Substances
LinkOut - more resources
Full Text Sources
Other Literature Sources


