The danger signal, extracellular ATP, is a sensor for an airborne allergen and triggers IL-33 release and innate Th2-type responses - PubMed (original) (raw)
The danger signal, extracellular ATP, is a sensor for an airborne allergen and triggers IL-33 release and innate Th2-type responses
Hideaki Kouzaki et al. J Immunol. 2011.
Abstract
The molecular mechanisms underlying the initiation of innate and adaptive proallergic Th2-type responses in the airways are not well understood. IL-33 is a new member of the IL-1 family of molecules that is implicated in Th2-type responses. Airway exposure of naive mice to a common environmental aeroallergen, the fungus Alternaria alternata, induces rapid release of IL-33 into the airway lumen, followed by innate Th2-type responses. Biologically active IL-33 is constitutively stored in the nuclei of human airway epithelial cells. Exposing these epithelial cells to A. alternata releases IL-33 extracellularly in vitro. Allergen exposure also induces acute extracellular accumulation of a danger signal, ATP; autocrine ATP sustains increases in intracellular Ca(2+) concentration and releases IL-33 through activation of P2 purinergic receptors. Pharmacological inhibitors of purinergic receptors or deficiency in the P2Y2 gene abrogate IL-33 release and Th2-type responses in the Alternaria-induced airway inflammation model in naive mice, emphasizing the essential roles for ATP and the P2Y(2) receptor. Thus, ATP and purinergic signaling in the respiratory epithelium are critical sensors for airway exposure to airborne allergens, and they may provide novel opportunities to dampen the hypersensitivity response in Th2-type airway diseases such as asthma.
Figures
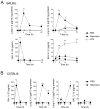
Figure 1. Airway exposure of naïve mice to Alternaria extract induces IL-33 release and Th2-type immune responses
BALB/c or C57BL/6 mice received intranasal PBS, Alternaria extract or LPS. Mice were killed, and BAL fluids and lungs were collected. Kinetics of IL-5 and IL-13 levels (lung) and IL-33 and IL-1β levels (BAL) in BALB/c mice (A) and C57BL/6 mice (B) are shown. Error bars represent the mean ± the SEM (3 or 4 mice per treatment group per each time point). * and ** p<0.05 and p<0.01 compared to PBS-treated mice by Student’s t test, respectively.
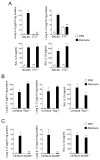
Figure 2. Early Th2-type immune response of naïve mice exposed to Alternaria extract is dependent on the IL-33/ST2 pathway but independent of adaptive immunity
Mice deficient in ST2, Rag1 or MyD88 or their control mice received intranasal PBS or Alternaria extract. (A) One h (for IL-33) or 12 h (for IL-5, IL-6 and IL-13) after receiving PBS or Alternaria extract, BAL levels of IL-33 and IL-6 and lung levels of IL-5 and IL-13 were measured and compared between wild-type BALB/c and _ST2_−/− mice (BALB/c background). Error bars represent the mean ± the SEM (5–12 mice per strain per treatment group). ** p<0.01 compared to wild-type mice receiving Alternaria by Mann-Whitney U test. (B) One h (for IL-33) or 12 h (for IL-5 and IL-13) after receiving PBS or Alternaria extract, BAL levels of IL-33 and lung levels of IL-5 and IL-13 were measured and compared between wild-type C57BL/6 mice and _Rag1_−/− mice (C57BL/6 background). Error bars represent the mean ± the SEM (4–8 mice per strain per treatment group). (C) Lung levels of IL-5 and IL-13 and BAL levels of IL-33 were compared between wild-type C57BL/6 and _MyD88_−/− mice (C57BL/6 background) 12 h (for IL-5) or 1 h (for IL-33) after receiving PBS or Alternaria extract. Error bars represent the mean ± the SEM (5–6 mice per strain per treatment group). ** p<0.01 compared to wild-type mice receiving Alternaria by Mann-Whitney U test.
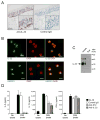
Figure 3. Biologically-active full-length 30 kDa IL-33 protein is stored in nuclei of airway epithelial cells
(A) Nasal specimens from 12 normal individuals were stained with rabbit anti-human IL-33 or normal rabbit IgG. Results shown are representative. Insets show higher magnifications of the epithelium. (B) NHBE cells were cultured, fixed, permeabilized and stained with rabbit anti-human IL-33 (top panels) or rabbit anti-HMGB1 (lower panels), followed by FITC-conjugated goat anti-rabbit IgG. After mounting and staining with a nuclear staining dye, DAPI, cells were visualized by confocal microscopy. Left panels show FITC-images with anti-IL-33 or anti-HMGB1; middle panels show nuclear staining with DAPI (pseudocolored); right panels show overlays of left and middle panels. Results are representative of 4 independent experiments. Scale bars indicate 20 μm. (C) Immunoblot analysis of NHBE cell lysate (left lane) and cell culture supernatant (right lane) used anti-human IL-33. Results are representative of 3 independent experiments. (D) Isolated CD4+T cells were cultured with DCs at a 1:10 DC:T cell ratio with medium alone or with a 10% freeze-thaw lysate of NHBE cells for 10 days. To block the IL-33/ST2 pathway, goat anti-human IL-33, goat anti-mouse ST2 or normal goat IgG were included. Concentrations of IL-5, IL-13, and IFN-γ were measured in supernatants by ELISA. Error bars represent the mean ± the SEM (6 independent experiments). * and ** p<0.05 and p<0.01 compared to the samples with lysate but without antibodies by Mann-Whitney U test, respectively.
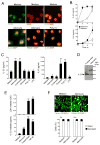
Figure 4. IL-33 is released extracellularly in a non-cytotoxic manner by NHBE cells exposed to allergen extracts
(A) NHBE cells were stimulated with medium (upper panels), Alternaria extract (left and middle lower panels), or Poly I:C (right lower panel) for 4 h. Cells were stained and analyzed as in Figure 3. In upper row, left panel shows FITC-images with anti-IL-33, middle panel shows nuclear staining with DAPI (pseudocolored), and right panel shows overlay of left and middle panels. In lower row, left panel shows overlay of anti-IL-33 and DAPI images, middle panel shows overlay of anti-HMGB1 and DAPI images, and right panel shows overlay of anti-IL-33 and DAPI images. Results are representative of 4 independent experiments. (B) NHBE cells were incubated with medium alone or Alternaria extract (50 μg/ml) for up to 8 h. IL-33 and IL-6 concentrations in the cell-free supernatants were analyzed by ELISA. Error bars represent the mean ± the SEM (6 independent experiments). * and ** p<0.05 and p<0.01 compared to cells stimulated with medium alone by Mann-Whitney U test, respectively. (C) NHBE cells were stimulated with medium, Alternaria extract, Oriental cockroach extract, zymozan, poly I:C or LPS for 2 h (for IL-33 release, left panel) or 8 h (for IL-6 production, right panel). Cell-free supernatants were analyzed for IL-6 or IL-33 by ELISA. Error bars represent the mean ± the SEM (6 independent experiments). * and ** p<0.05 and p<0.01 compared to medium alone by Mann-Whitney U test, respectively. (D) Culture supernatants from NHBE cells, which were treated with five freeze/thaw cycles (left lane) or stimulated with Alternaria extract for 2 h (right lane), were analyzed by immunoblot with anti-human IL-33. Results are representative of 3 independent experiments. (E) NHBE cells were stimulated with medium or Alternaria extract for 2 h or treated with five freeze/thaw cycles or 1% NP-40. Cell-free supernatants were analyzed for LDH activity and for IL-33. Error bars represent the mean ± the SEM (6 independent experiments). ** p<0.01 compared to medium alone by Mann-Whitney U test. (F) NHBE cells were incubated with medium or Alternaria extract for 2 or 8 h and then incubated with calcein AM and EthD-1 for 30 min. Upper panels show fluorescence images from confocal microscopy. Lower panels show intact (calcein AM positive and EthD-1 negative) and damaged (EthD-1 positive) cells in 5 randomly selected fields that were were counted and expressed as percent of intact or damaged cells/total cell number. Error bars represent the mean ± the SEM (3 independent experiments).
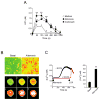
Figure 5. Exposure of NHBE cells to allergen extracts induces extracellular ATP release and increases [Ca2+]i
(A) NHBE cells were treated with medium, Alternaria or Oriental cockroach extracts. The kinetics of ATP concentrations in cell-free supernatants were measured. Error bars represent the mean ± the SEM (4 independent experiments). * and ** p<0.05 and p<0.01 compared to medium alone by Mann-Whitney U test, respectively. (B) NHBE cells were loaded with Fura-2-AM and exposed to Alternaria extract. Fluorescence in single cells was monitored and analyzed by inverted microscopy, as described in Materials and Methods. Upper panels show [Ca2+]i in NHBE cell monolayer with pseudocolors (green<yellow<orange<red<white in the order of [Ca2+]i). Left panel shows before exposure, and right panel shows 300 s after exposure to Alternaria. Lower panels use pseudocolors to show the kinetic changes in [Ca2+]i in a randomly-selected NHBE cell. Images 1 through 6 were taken at 285 s, 293 s, 301 s, 317 s, 333 s and 347 s after exposure to Alternaria. Results are representative of 5 independent experiments. (C) NHBE cells were loaded with Fura-2-AM, preincubated with or without EGTA, exposed to Alternaria extract (arrow), and 600 s later 10 μM UTP (arrow) was added to the cells with EGTA. Fluorescence and [Ca2+]i in single cells were analyzed as described above. Left panel shows kinetic changes in [Ca2+]i in one experiment from 50 randomly-selected cells, representative of 3 experiments. Right panel shows [Ca2+]i before (basal) and 400 s after exposure to Alternaria. Error bars represent the mean ± the SEM (3 independent experiments each with 50 cells). ** p<0.01 compared to basal [Ca2+]i by Student’s t test.
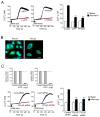
Figure 6. Blockade of P2 purinergic receptors by pharmacologic agents or siRNA attenuates Ca2+ response in NHBE cells exposed to Alternaria extract
(A) NHBE cells were loaded with Fura-2-AM, preincubated with or without 300 μM oATP or 50 μM PPADS, and exposed to Alternaria extract (see arrows). Fluorescence and [Ca2+]i in single cells were analyzed as in Figure 4. Left and middle panels show kinetic changes in [Ca2+]i in one experiment from 50 randomly-selected cells, representative of 3 experiments. Right panel shows [Ca2+]i before (basal) and 400 s after exposure to Alternaria. Error bars represent the mean ± the SEM (3 independent experiments with 50 cells each). ** p<0.01 compared to [Ca2+]i after Alternaria exposure without oATP or PPADS by ANOVA. (B) NHBE cells were fixed, permeabilized and stained with rabbit anti-P2X7R or anti-P2Y2R, followed by FITC-conjugated goat anti-rabbit IgG. After mounting and staining with DAPI, cells were visualized by confocal microscopy. Results are representative of 3 independent experiments. Scale bars indicate 20 μm. (C) NHBE cells were transfected with siRNA against P2X7R or P2Y2R or control RNA and grown for 48 h. Expression levels of P2X7R and P2Y2R mRNA by NHBE cells were examined by real-time RT-PCR. In replicate wells, transfected NHBE cells were loaded with Fura-2-AM, and exposed to Alternaria (see arrows). Fluorescence and [Ca2+]i in single cells were analyzed as in Figure 4. Left upper panels show expression of P2X7R and P2Y2R mRNA. Data were normalized to the amounts of P2X7R and P2Y2R mRNA in NHBE cells without siRNA transfection as 100%. Results are representative of 3 experiments. Left lower panels show kinetic changes in [Ca2+]i in one experiment from 50 randomly-selected cells, representative of 3 experiments. Right panel shows [Ca2+]i before (basal) and 400 s after exposure to Alternaria. Error bars represent the mean ± the SEM (3 independent experiments each with 50 cells). ** p<0.01 compared to [Ca2+]i after exposure to Alternaria in the cells treated with control siRNA by ANOVA.
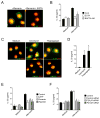
Figure 7. ATP-mediated increase in [Ca2+]i is necessary and sufficient to translocate and release nuclear IL-33
(A) NHBE cells were preincubated without (left panel) or with (right panel) 1 mM EGTA and stimulated with Alternaria extract for 4 h. The cells were stained with anti-human IL-33 and DAPI, and analyzed as in Figure 2. Panels show overlay of anti-IL-33 and DAPI images and are representative of 4 independent experiments. (B) NHBE cells were preincubated with medium, EGTA, or BAPTA-AM and stimulated with medium or Alternaria extract for 2 h. IL-33 in cell-free supernatants was analyzed by ELISA. Error bars represent the mean ± the SEM (6 independent experiments). * and ** p<0.05 and p<0.01 compared to cells stimulated with Alternaria without inhibitors by Mann-Whitney U test, respectively. (C) NHBE cells were treated with medium (left), ionomycin (middle), or thapsigargin (right) for 4 h. The cells were stained with anti-human IL-33 (upper panels) or anti-HMGB1 (lower panels) and DAPI, and analyzed as in Figure 2. Upper panels show overlay of anti-IL-33 and DAPI, and lower panels show overlay of anti-HMGB1 and DAPI. Results are representative of 4 independent experiments. (D) NHBE cells were incubated with medium, ionomycin, or thapsigargin for 2 h. IL-33 in cell-free supernatants was analyzed by ELISA. Error bars represent the mean ± the SEM (4 independent experiments). * p<0.05 compared to cells incubated with medium alone by Mann-Whitney U test. (E) NHBE cells were preincubated with medium, oATP, suramin or apyrase and stimulated with medium or Alternaria extract for 2 h. IL-33 in cell-free supernatants was analyzed by ELISA. Error bars represent the mean ± the SEM (6 independent experiments). * p<0.05 compared to cells stimulated with Alternaria without inhibitors by Mann-Whitney U test. (F) NHBE cells were untreated (control) or transfected with siRNA against P2X7R or P2Y2R or control siRNA and cultured for 48 h. Cells were stimulated with medium or Alternaria extract for 2 h. IL-33 in cell-free supernatants was analyzed by ELISA. Error bars represent the mean ± the SEM (6 independent experiments). * p<0.05 compared to control siRNA-treated cells stimulated with Alternaria extract by Mann-Whitney U test.
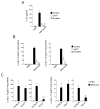
Figure 8. Administration of P2 purinergic R antagonists or deficiency in P2Y2 gene attenuates IL-33 release and innate Th2-type responses in mice
(A) BALB/c mice received intranasal PBS or Alternaria extract mixed with PBS, oATP or suramin. After 1 h, mice were killed, and IL-33 in BAL fluid supernatants was measured by ELISA. Error bars represent the mean ± the SEM (5 mice per group). * p<0.05 compared to mice receiving Alternaria without inhibitors by Mann-Whitney U test. (B) BALB/c mice received intranasal PBS or Alternaria extract mixed with PBS, oATP or suramin. After 12 h, mice were killed, and IL-5 and IL-13 in lung homogenates were measured by ELISA. Error bars represent the mean ± the SEM (5 mice per group). * p<0.05 compared to mice receiving Alternaria without inhibitors by Mann-Whitney U test. (C) Wild-type C57BL/6 mice, _P2X7_−/− or _P2Y2_−/− mice received intranasal PBS or Alternaria. After 12 h, mice were killed and IL-5 and IL-13 in lung homogenates were measured by ELISA. Error bars represent the mean ± the SEM (6 mice per group). * and ** p<0.05 and p<0.01 compared to wild-type mice receiving Alternaria by Mann-Whitney U test, respectively.
Similar articles
- Airway uric acid is a sensor of inhaled protease allergens and initiates type 2 immune responses in respiratory mucosa.
Hara K, Iijima K, Elias MK, Seno S, Tojima I, Kobayashi T, Kephart GM, Kurabayashi M, Kita H. Hara K, et al. J Immunol. 2014 May 1;192(9):4032-42. doi: 10.4049/jimmunol.1400110. Epub 2014 Mar 24. J Immunol. 2014. PMID: 24663677 Free PMC article. - IL-33 and thymic stromal lymphopoietin mediate immune pathology in response to chronic airborne allergen exposure.
Iijima K, Kobayashi T, Hara K, Kephart GM, Ziegler SF, McKenzie AN, Kita H. Iijima K, et al. J Immunol. 2014 Aug 15;193(4):1549-59. doi: 10.4049/jimmunol.1302984. Epub 2014 Jul 11. J Immunol. 2014. PMID: 25015831 Free PMC article. - House dust mite allergens induce interleukin 33 (IL-33) synthesis and release from keratinocytes via ATP-mediated extracellular signaling.
Dai X, Tohyama M, Murakami M, Shiraishi K, Liu S, Mori H, Utsunomiya R, Maeyama K, Sayama K. Dai X, et al. Biochim Biophys Acta Mol Basis Dis. 2020 May 1;1866(5):165719. doi: 10.1016/j.bbadis.2020.165719. Epub 2020 Feb 7. Biochim Biophys Acta Mol Basis Dis. 2020. PMID: 32044300 - Allergens and the airway epithelium response: gateway to allergic sensitization.
Lambrecht BN, Hammad H. Lambrecht BN, et al. J Allergy Clin Immunol. 2014 Sep;134(3):499-507. doi: 10.1016/j.jaci.2014.06.036. J Allergy Clin Immunol. 2014. PMID: 25171864 Review. - Airway epithelial regulation of pulmonary immune homeostasis and inflammation.
Hallstrand TS, Hackett TL, Altemeier WA, Matute-Bello G, Hansbro PM, Knight DA. Hallstrand TS, et al. Clin Immunol. 2014 Mar;151(1):1-15. doi: 10.1016/j.clim.2013.12.003. Epub 2013 Dec 14. Clin Immunol. 2014. PMID: 24503171 Review.
Cited by
- Epithelial cell alarmin cytokines: Frontline mediators of the asthma inflammatory response.
Duchesne M, Okoye I, Lacy P. Duchesne M, et al. Front Immunol. 2022 Oct 14;13:975914. doi: 10.3389/fimmu.2022.975914. eCollection 2022. Front Immunol. 2022. PMID: 36311787 Free PMC article. Review. - The Contradictory Role of Interleukin-33 in Immune Cells and Tumor Immunity.
Zhang X, Chen W, Zeng P, Xu J, Diao H. Zhang X, et al. Cancer Manag Res. 2020 Aug 21;12:7527-7537. doi: 10.2147/CMAR.S262745. eCollection 2020. Cancer Manag Res. 2020. PMID: 32904627 Free PMC article. Review. - CARMA3 Is Critical for the Initiation of Allergic Airway Inflammation.
Causton B, Ramadas RA, Cho JL, Jones K, Pardo-Saganta A, Rajagopal J, Xavier RJ, Medoff BD. Causton B, et al. J Immunol. 2015 Jul 15;195(2):683-94. doi: 10.4049/jimmunol.1402983. Epub 2015 Jun 3. J Immunol. 2015. PMID: 26041536 Free PMC article. - IL-33 promotes eosinophilia in vivo and antagonizes IL-5-dependent eosinophil hematopoiesis ex vivo.
Dyer KD, Percopo CM, Rosenberg HF. Dyer KD, et al. Immunol Lett. 2013 Feb;150(1-2):41-7. doi: 10.1016/j.imlet.2012.12.002. Epub 2012 Dec 11. Immunol Lett. 2013. PMID: 23246474 Free PMC article. - Mast Cell Cytokines in Acute and Chronic Gingival Tissue Inflammation: Role of IL-33 and IL-37.
Trimarchi M, Lauritano D, Ronconi G, Caraffa A, Gallenga CE, Frydas I, Kritas SK, Calvisi V, Conti P. Trimarchi M, et al. Int J Mol Sci. 2022 Oct 31;23(21):13242. doi: 10.3390/ijms232113242. Int J Mol Sci. 2022. PMID: 36362030 Free PMC article. Review.
References
- Cookson W. The immunogenetics of asthma and eczema: a new focus on the epithelium. Nat Rev Immunol. 2004;4:978–988. - PubMed
- Holt PG, Macaubas C, Stumbles PA, Sly PD. The role of allergy in the development of asthma. Nature. 1999;402:B12–17. - PubMed
- Lambrecht BN, Hammad H. Biology of lung dendritic cells at the origin of asthma. Immunity. 2009;31:412–424. - PubMed
Publication types
MeSH terms
Substances
Grants and funding
- R01 AI034486/AI/NIAID NIH HHS/United States
- HL095811/HL/NHLBI NIH HHS/United States
- R56 DK074010/DK/NIDDK NIH HHS/United States
- R56 AI034486/AI/NIAID NIH HHS/United States
- AI34486/AI/NIAID NIH HHS/United States
- R21 HL095811/HL/NHLBI NIH HHS/United States
- AI49235/AI/NIAID NIH HHS/United States
- R01 AI034486-15/AI/NIAID NIH HHS/United States
- R01 AI071106/AI/NIAID NIH HHS/United States
- DK074010/DK/NIDDK NIH HHS/United States
- R56 AI049235/AI/NIAID NIH HHS/United States
- R01 HL110539/HL/NHLBI NIH HHS/United States
- R29 AI034486/AI/NIAID NIH HHS/United States
- R01 AI049235-04/AI/NIAID NIH HHS/United States
- R01 AI071106-04/AI/NIAID NIH HHS/United States
- R01 AI049235/AI/NIAID NIH HHS/United States
LinkOut - more resources
Full Text Sources
Other Literature Sources
Molecular Biology Databases
Miscellaneous
