Kindlin-3-mediated signaling from multiple integrin classes is required for osteoclast-mediated bone resorption - PubMed (original) (raw)
Kindlin-3-mediated signaling from multiple integrin classes is required for osteoclast-mediated bone resorption
Sarah Schmidt et al. J Cell Biol. 2011.
Abstract
The blood cell-specific kindlin-3 protein is required to activate leukocyte and platelet integrins. In line with this function, mutations in the KINDLIN-3 gene in man cause immunodeficiency and severe bleeding. Some patients also suffer from osteopetrosis, but the underlying mechanism leading to abnormal bone turnover is unknown. Here we show that kindlin-3-deficient mice develop severe osteopetrosis because of profound adhesion and spreading defects in bone-resorbing osteoclasts. Mechanistically, loss of kindlin-3 impairs the activation of β1, β2, and β3 integrin classes expressed on osteoclasts, which in turn abrogates the formation of podosomes and sealing zones required for bone resorption. In agreement with these findings, genetic ablation of all integrin classes abolishes the development of podosomes, mimicking kindlin-3 deficiency. Although loss of single integrin classes gives rise to podosomes, their resorptive activity is impaired. These findings show that osteoclasts require their entire integrin repertoire to be regulated by kindlin-3 to orchestrate bone homeostasis.
Figures
Figure 1.
Kindlin-3−/− mice develop severe osteopetrosis. (A and B) Histology of tibiae of P4 wild-type and kindlin-3−/− mice stained with hematoxylin and eosin (A) and van Kossa (B). (C and D) Quantitative peripheral computer tomography measurements determining bone mineral density (C) and histomorphometric analysis to determine bone surface from bones of P4 wild-type and kindlin-3−/− mice (D); n = 3. (E) Histology of tibiae of P4 wild-type and kindlin-3−/− mice stained for TRAP activity. (F and G) Histomorphometric analyses determining the number of osteoclasts (F) and surface covered by osteoclasts (G) of wild-type and kindlin-3−/− mice; n = 3. (H) Ca2+ levels in serum of P4 wild-type and kindlin-3−/− mice; n = 8. (I) PTH levels in plasma of P3 wild-type and kindlin-3−/− mice; n = 10. (J and K) Resorption pits (J) and their quantification (K) of wild-type and kindlin-3−/− osteoclasts cultured on calcium apatite coated slides; n = 7. (L) Zymography of cell culture supernatants from primary wild-type and kindlin-3−/− osteoclasts. (M) Cathepsin K activity from lysates of primary wild-type and kindlin-3−/− osteoclasts; n = 11. Data are presented as mean ± SD (error bars). P-values indicate significant differences from wild-type (Student’s t test). n.s., not significant. Bars: (A and B) 250 µm; (E, top) 250 µm; (E, bottom) 25 µm; (J) 100 µm.
Figure 2.
Differentiation of kindlin-3−/− osteoclasts. (A) RANKL/OPG ratio in plasma of P3 wild-type and kindlin-3−/− mice; n = 11. (B) RT-PCR of osteoclastogenic markers upon M-CSF and RANKL treatment of wild-type and kindlin-3−/− fetal liver cells. (C) RT-PCR of kindlin-1 and -2 expression during in vitro osteoclast differentiation. RNA from keratinocytes served as positive control. (D) Number of nuclei per osteoclast 5 d after induction of differentiation; 1,004 cells of each genotype obtained from five independent experiments were analyzed. (E) Osteoclast nuclear numbers determined from histological sections of P4 tibiae. 63 and 252 osteoclasts from wild-type and kindlin-3−/− bone sections were analyzed, respectively. Data are presented as mean ± SD (error bars). P-values indicate significant differences from wild-type (Student’s t test).
Figure 3.
Integrin defects in kindlin-3−/− osteoclasts. (A) Adhesion of primary wild-type and kindlin-3−/− osteoclasts to osteopontin. Number of adherent cells per field of view (FOV) is shown. (B) Surface expression of β1, β3, β5, and αV integrins on wild-type (green) and kindlin-3−/− (red) macrophages. Isotype control staining is shown in dark blue. Numbers above graphs indicate integrin expression on kindlin-3−/− cells (mean ± SD) relative to wild-type cells (n = 6). (C) 9EG7 binding on wild-type and kindlin-3−/− macrophages in the presence or absence of 2 mM MnCl2. (D) Binding of Alexa Fluor 647–labeled FNIII7-10 by wild-type and kindlin-3−/− macrophages in the presence or absence of 3 mM MnCl2. Data show mean ± SD of four independent experiments and were subtracted by background binding of the isotype and EDTA control, respectively. (E) Wild-type and kindlin-3−/− macrophages plated on ICAM-1 in the presence or absence of 1 mM MnCl2. P-values indicate significant differences from wild-type (Student’s t test).
Figure 4.
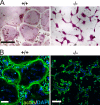
Defective spreading of kindlin-3−/− osteoclasts. (A) Wild-type and kindlin-3−/− osteoclasts grown on glass coverslips and stained for TRAP. (B) F-actin (stained with phalloidin, green) and nuclei (DAPI, blue) in wild-type and kindlin-3−/− osteoclasts. Bars, 100 µm.
Figure 5.
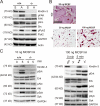
Impaired adhesion and M-CSF signaling in kindlin-3−/− pre-osteoclasts. (A) Wild-type and kindlin-3−/− pre-osteoclasts either maintained in suspension (S) or replated on vitronectin (A). Western blotting for kindlin-3, p-FAK, FAK, p-src, Src, p-Pyk2, and Pyk2. GAPDH and actin served as loading controls. (B) TRAP staining of wild-type and kindlin-3−/− osteoclasts treated with 40 ng/ml RANKL together with either 20 ng/ml or 100 ng/ml M-CSF. Bar, 250 µm. (C) Starved wild-type and kindlin-3−/− osteoclasts treated with either 10 ng/ml or 100 ng/ml M-CSF. Western blotting for activated Erk and Akt. Activated Syk was determined by immunoprecipitation followed by immunoblotting with anti-phosphotyrosine (4G10) antibody.
Figure 6.
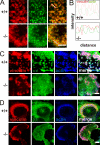
Impaired podosome formation in kindlin-3−/− osteoclasts. (A) Vinculin (red) and F-actin staining (phalloidin, green) of pre-osteoclasts plated on glass coverslips and observed by confocal microscopy. (B) Fluorescence intensity profile through three actin-core units (indicated by the white lines in A) of wild-type and kindlin-3−/− pre-osteoclasts. (C and D) vinculin (red) and F-actin staining (phalloidin, blue) together with αv integrin (green; C) or β1 integrin (green; D). Bars (A and C) 5 µm; (D) 10 µm.
Figure 7.
Podosomal actin core formation is not abolished in kindlin-3−/− cells. (A) Scanning electron microscopy of basal membrane preparations of wild-type and kindlin-3−/− osteoclasts. (B–D) Colocalization of cortactin (red) and F-actin (phalloidin, green; B), F-actin (red) and Arp2/3 (green; C), and WASp (red) and F-actin (green; D) in podosome clusters of wild-type and kindlin-3−/− pre-osteoclasts analyzed by confocal microscopy. Bars: (A, left) 1 µm; (A, right) 500 nm; (B–D) 10 µm.
Figure 8.
Abnormal F-actin distribution but normal microtubule organization and acetylation in kindlin-3−/− osteoclasts. (A) Vinculin (red) and F-actin staining (phalloidin, green) of wild-type and kindlin-3−/− osteoclasts plated on glass coverslips. (B) Vinculin (red) and F-actin staining (phalloidin, green) of wild-type and kindlin-3−/− osteoclasts plated on mineral surface of osteologic slides. DAPI (blue) shows nuclei (A and B). (C) Wild-type and kindlin-3−/− osteoclasts were labeled with phalloidin (blue), anti-acetylated tubulin (green), and anti-tubulin antibodies. (D) Cell lysates from wild-type and kindlin-3−/− osteoclasts were immunoblotted with antibodies against kindlin-3, acetylated tubulin, and tubulin. Antibodies against actin and GAPDH were used as loading controls. Bars: (A) 25 µm; (B) 100 µm; (C) 10 µm.
Figure 9.
Podosomes and actin belts in integrin-deficient osteoclasts. (A) Wild-type and single, double, and triple integrin-deficient osteoclasts stained for TRAP. (B) Vinculin (red) and F-actin staining (phalloidin, green) of wild-type and integrin-deficient pre-osteoclasts plated on glass. (C) Diameters of actin dots in pre-osteoclasts with indicated genotypes measured using MetaMorph software; n = 6/5/5/8/9/6/6/6/8/9 different cells from each genotype taken to measure the actin core size. (D) Vinculin (red) and F-actin staining (phalloidin, green) of wild-type and integrin-deficient osteoclasts plated on glass. DAPI (blue) shows nuclei. (E) Diameter of podosomal belts of wild-type and integrin-deficient osteoclasts plated on glass. Data are presented as mean ± SD (error bars). P-values indicate significant differences from wild-type (Student’s t test). Bars: (A) 100 µm; (B) 2 µm; (D, top) 25 µm; (D, bottom) 5 µm.
Figure 10.
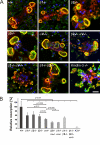
Sealing zones of integrin-deficient osteoclasts. (A) Vinculin (red) and F-actin staining (phalloidin, green) of wild-type and integrin-deficient osteoclasts plated on a mineral surface. DAPI staining (blue) shows nuclei. Bar, 25 µm. (B) Resorption activity of wild-type and integrin-deficient osteoclasts plated on calcium apatite-coated slides quantified with MetaMorph. Number of analyzed slides per genotype: n = 26/6/6/6/6/3/3/3/8. Data are presented as mean ± SD (error bars). P-values indicate significant differences from wild-type (Student’s t test).
Similar articles
- Low kindlin-3 levels in osteoclasts of kindlin-3 hypomorphic mice result in osteopetrosis due to leaky sealing zones.
Klapproth S, Richter K, Türk C, Bock T, Bromberger T, Dominik J, Huck K, Pfaller K, Hess MW, Reichel CA, Krüger M, Nakchbandi IA, Moser M. Klapproth S, et al. J Cell Sci. 2021 Nov 15;134(22):jcs259040. doi: 10.1242/jcs.259040. Epub 2021 Nov 26. J Cell Sci. 2021. PMID: 34704600 - A new mutation in the KINDLIN-3 gene ablates integrin-dependent leukocyte, platelet, and osteoclast function in a patient with leukocyte adhesion deficiency-III.
Crazzolara R, Maurer K, Schulze H, Zieger B, Zustin J, Schulz AS. Crazzolara R, et al. Pediatr Blood Cancer. 2015 Sep;62(9):1677-9. doi: 10.1002/pbc.25537. Epub 2015 Apr 8. Pediatr Blood Cancer. 2015. PMID: 25854317 - Dynamic changes in the osteoclast cytoskeleton in response to growth factors and cell attachment are controlled by beta3 integrin.
Faccio R, Novack DV, Zallone A, Ross FP, Teitelbaum SL. Faccio R, et al. J Cell Biol. 2003 Aug 4;162(3):499-509. doi: 10.1083/jcb.200212082. J Cell Biol. 2003. PMID: 12900398 Free PMC article. - Regulatory mechanism of osteoclast activation.
Nakamura I, Rodan GA, Duong LT. Nakamura I, et al. J Electron Microsc (Tokyo). 2003;52(6):527-33. doi: 10.1093/jmicro/52.6.527. J Electron Microsc (Tokyo). 2003. PMID: 14756240 Review. - Integrin-mediated signaling in the regulation of osteoclast adhesion and activation.
Duong LT, Rodan GA. Duong LT, et al. Front Biosci. 1998 Aug 1;3:d757-68. doi: 10.2741/A319. Front Biosci. 1998. PMID: 9682033 Review.
Cited by
- Heterogeneity and Actin Cytoskeleton in Osteoclast and Macrophage Multinucleation.
Takito J, Nakamura M. Takito J, et al. Int J Mol Sci. 2020 Sep 10;21(18):6629. doi: 10.3390/ijms21186629. Int J Mol Sci. 2020. PMID: 32927783 Free PMC article. Review. - Combined AFM and super-resolution localisation microscopy: Investigating the structure and dynamics of podosomes.
Hirvonen LM, Marsh RJ, Jones GE, Cox S. Hirvonen LM, et al. Eur J Cell Biol. 2020 Sep;99(7):151106. doi: 10.1016/j.ejcb.2020.151106. Epub 2020 Jul 22. Eur J Cell Biol. 2020. PMID: 33070038 Free PMC article. - Lessons from rare maladies: leukocyte adhesion deficiency syndromes.
Harris ES, Weyrich AS, Zimmerman GA. Harris ES, et al. Curr Opin Hematol. 2013 Jan;20(1):16-25. doi: 10.1097/MOH.0b013e32835a0091. Curr Opin Hematol. 2013. PMID: 23207660 Free PMC article. Review. - Leukocyte adhesion deficiency-I variant syndrome (LAD-Iv, LAD-III): molecular characterization of the defect in an index family.
Harris ES, Smith TL, Springett GM, Weyrich AS, Zimmerman GA. Harris ES, et al. Am J Hematol. 2012 Mar;87(3):311-3. doi: 10.1002/ajh.22253. Epub 2011 Dec 3. Am J Hematol. 2012. PMID: 22139635 Free PMC article. - Integrin signalling and function in immune cells.
Zhang Y, Wang H. Zhang Y, et al. Immunology. 2012 Apr;135(4):268-75. doi: 10.1111/j.1365-2567.2011.03549.x. Immunology. 2012. PMID: 22211918 Free PMC article. Review.
References
Publication types
MeSH terms
Substances
LinkOut - more resources
Full Text Sources
Other Literature Sources
Molecular Biology Databases


