SirT3 suppresses hypoxia inducible factor 1α and tumor growth by inhibiting mitochondrial ROS production - PubMed (original) (raw)
. 2011 Jun 30;30(26):2986-96.
doi: 10.1038/onc.2011.37. Epub 2011 Feb 28.
Affiliations
- PMID: 21358671
- PMCID: PMC3134877
- DOI: 10.1038/onc.2011.37
Free PMC article
SirT3 suppresses hypoxia inducible factor 1α and tumor growth by inhibiting mitochondrial ROS production
E L Bell et al. Oncogene. 2011.
Free PMC article
Abstract
It has become increasing clear that alterations in cellular metabolism have a key role in the generation and maintenance of cancer. Some of the metabolic changes can be attributed to the activation of oncogenes or loss of tumor suppressors. Here, we show that the mitochondrial sirtuin, SirT3, acts as a tumor suppressor via its ability to suppress reactive oxygen species (ROS) and regulate hypoxia inducible factor 1α (HIF-1α). Primary mouse embryo fibroblasts (MEFs) or tumor cell lines expressing SirT3 short-hairpin RNA exhibit a greater potential to proliferate, and augmented HIF-1α protein stabilization and transcriptional activity in hypoxic conditions. SirT3 knockdown increases tumorigenesis in xenograft models, and this is abolished by giving mice the anti-oxidant N-acetyl cysteine. Moreover, overexpression of SirT3 inhibits stabilization of HIF-1α protein in hypoxia and attenuates increases in HIF-1α transcriptional activity. Critically, overexpression of SirT3 decreases tumorigenesis in xenografts, even when induction of the sirtuin occurs after tumor initiation. These data suggest that SirT3 acts to suppress the growth of tumors, at least in part through its ability to suppress ROS and HIF-1α.
Figures
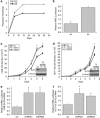
Figure 1
SirT3 loss of function increases proliferation and HIF-1α activity. (a) Population doublings in primary SirT3 wild type (wt) and SirT3−/− (KO) MEFs cultured in normal oxygen conditions (21% O2). (b) Luciferase values from immortalized wt and KO MEFs transfected with HRE-luciferase in normoxia. SirT3 protein levels in 143B (c) and HCT116 (d) cells stably expressing a scrambled control shRNA (scr) or two different shRNAs that target SirT3. Both shRNA sequences increase the rate of cellular proliferation. Relative luciferase values of 143B (e) and HCT116 (f) cells in SirT3 stable knockdown cell lines (shRNA) or a scrambled control vector (scr) line transfected with HRE-luciferase. Error bars are s.e.m. and * indicates a P value <0.05 with two-tailed Student's _t_-test.
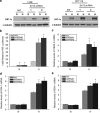
Figure 2
Knockdown of SirT3 augments the hypoxic response. (a) HIF-1α protein levels from whole cell lysates of indicated tumor cell lines incubated at normoxic (N, 21% O2) or hypoxic (H, 1% O2) conditions for 4 h. (b) Relative luciferase values of 143B cells in SirT3 stable knockdown cell lines (shRNA) or a scrambled control vector (scr) line transfected with HRE-luciferase cultured in normoxic (N, 21% O2) or hypoxic (H, 1% O2) conditions for 16 h. Quantitative PCR for VEGF-A (c), PGK-1 (d) and PDK-1 (e) on RNA isolated from 143B cells stably expressing SirT3 shRNA or a scrambled control vector (scr) cultured in normoxic (N, 21% O2) or hypoxic (H, 1% O2) conditions for 16hrs. Error bars are s.e.m. and * indicates a P value <0.05 with two-tailed Student's _t_-test.
Figure 3
SirT3 gain of function inhibits hypoxic activation of HIF-1α. (a) Western blot of 143B cells stably overexpressing SirT3 tagged with V5. (b) Western blots of HIF-1α using total cell lysates from 143B control (c) and SirT3 overexpressing cells in normoxic (N, 21% O2) or hypoxic (H, 1% O2) conditions or treated with DMOG (d) for 16 h. (c) Relative luciferase values in 143B SirT3 overexpressing cells transfected with HRE-luciferase. (d) PGK1 mRNA from 143B SirT3 overexpressing cells in normoxic (N21% O2) or hypoxic (H, 1% O2) conditions. Error bars are s.e.m. and * indicates a P value <0.05 with two-tailed Student's _t_-test.
Figure 4
ROS levels are regulated by SirT3. Relative levels of dihydroethidium (DHE) fluorescence in wild type (wt) or SirT3 −/− (KO) primary MEFs (a) and immortalized MEFs (b) treated with 10 μ DHE in normal oxygen conditions and then analyzed by flow cytometry. Each data point represents an independent culture of cells. (c) Relative fluorescence of 143B cells with SirT3 stably knocked down with two different SirT3 shRNAs or a scrambled control after incubation with DHE. (d) Western blots of whole cell lysates isolated from 143B cells stably overexpressing SirT3 Flag and their relative fluorescence after incubation with DHE with or without antimycin A (2 μg/ml). Error bars are s.e.m. and * indicates a P value <0.05 with two-tailed Student's _t_-test.
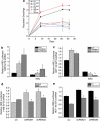
Figure 5
Increased HIF-1α activity in the absence of SirT3 is mediated by ROS from complex III. (a) Population doublings of two wild-type and two SirT3−/− (KO) primary MEFs in the presence or absence of NAC (5 m). The 143B (b) and HCT116 (c) SirT3 stable knockdown cell lines transfected with HRE-luciferase with or without 24 h NAC (10 m) pretreatment. Luciferase activity in stigmatellin (1 μ) treated or not treated (NT) 143B (d) and HCT116 (e) stable cell lines with scrambled or SirT3 shRNA and transfected with HRE-luciferase. Error bars are s.e.m. and * indicates a P value <0.05 with two-tailed Student's _t_-test.
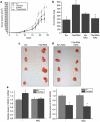
Figure 6
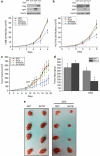
Loss of SirT3 in established human cancer cell lines increases tumor growth and is dependent on ROS. Tumor volume (a) and tumor mass (b) 24 days after subcutaneous injection of HCT116 scramble control and SirT3 knockdown cells in Nu/Nu mice with or without 40 m NAC supplementation in the drinking water. (c, d) Pictures of tumors from a and b after mice were euthanized. (e) Quantitative PCR for VEGF-A and SirT3 on RNA isolated from the tumors. Error bars are s.e.m. and * indicates a P value <0.05 with two-tailed Student's _t_-test.
Figure 7
Overexpression of SirT3 negatively regulates proliferation and tumorigenesis. Inducible overexpression of GFP and SirT3 in 143B (a) and HCT116 (b) decreases proliferation. Tumor volume (c) and tumor mass (d) of HCT116 GFP or SirT3 cells injected into the flanks of Nu/Nu mice. Doxycycline was added on day 9 to induce expression of GFP or SirT3. Error bars are s.e.m. and * indicates a P value <0.05 with two-tailed Student's _t_-test. (e) Pictures of tumors from c and d.
Similar articles
- SIRT3 Regulates the ROS-FPR1/HIF-1α Axis under Hypoxic Conditions to Influence Lung Cancer Progression.
Huang B, Ding J, Guo H, Wang H, Xu J, Zheng Q, Zhou L. Huang B, et al. Cell Biochem Biophys. 2023 Dec;81(4):813-821. doi: 10.1007/s12013-023-01180-x. Epub 2023 Sep 25. Cell Biochem Biophys. 2023. PMID: 37747648 Free PMC article. - Vosaroxin induces mitochondrial dysfunction and apoptosis in cervical cancer HeLa cells: Involvement of AMPK/Sirt3/HIF-1 pathway.
Zhao XL, Yu CZ. Zhao XL, et al. Chem Biol Interact. 2018 Jun 25;290:57-63. doi: 10.1016/j.cbi.2018.05.011. Epub 2018 May 22. Chem Biol Interact. 2018. PMID: 29800573 - Sirtuin 3 deficiency does not augment hypoxia-induced pulmonary hypertension.
Waypa GB, Osborne SW, Marks JD, Berkelhamer SK, Kondapalli J, Schumacker PT. Waypa GB, et al. Am J Respir Cell Mol Biol. 2013 Dec;49(6):885-91. doi: 10.1165/rcmb.2013-0191OC. Am J Respir Cell Mol Biol. 2013. PMID: 24047466 Free PMC article. - SIRT3 a Major Player in Attenuation of Hepatic Ischemia-Reperfusion Injury by Reducing ROS via Its Downstream Mediators: SOD2, CYP-D, and HIF-1_α_.
Katwal G, Baral D, Fan X, Weiyang H, Zhang X, Ling L, Xiong Y, Ye Q, Wang Y. Katwal G, et al. Oxid Med Cell Longev. 2018 Nov 13;2018:2976957. doi: 10.1155/2018/2976957. eCollection 2018. Oxid Med Cell Longev. 2018. PMID: 30538800 Free PMC article. Review. - The SirT3 divining rod points to oxidative stress.
Bell EL, Guarente L. Bell EL, et al. Mol Cell. 2011 Jun 10;42(5):561-8. doi: 10.1016/j.molcel.2011.05.008. Mol Cell. 2011. PMID: 21658599 Free PMC article. Review.
Cited by
- SIRT3 is a mitochondrial tumor suppressor: a scientific tale that connects aberrant cellular ROS, the Warburg effect, and carcinogenesis.
Haigis MC, Deng CX, Finley LW, Kim HS, Gius D. Haigis MC, et al. Cancer Res. 2012 May 15;72(10):2468-72. doi: 10.1158/0008-5472.CAN-11-3633. Cancer Res. 2012. PMID: 22589271 Free PMC article. - Physiological roles of mitochondrial reactive oxygen species.
Sena LA, Chandel NS. Sena LA, et al. Mol Cell. 2012 Oct 26;48(2):158-67. doi: 10.1016/j.molcel.2012.09.025. Mol Cell. 2012. PMID: 23102266 Free PMC article. Review. - Sirtuin-7 inhibits the activity of hypoxia-inducible factors.
Hubbi ME, Hu H, Kshitiz, Gilkes DM, Semenza GL. Hubbi ME, et al. J Biol Chem. 2013 Jul 19;288(29):20768-20775. doi: 10.1074/jbc.M113.476903. Epub 2013 Jun 9. J Biol Chem. 2013. PMID: 23750001 Free PMC article. - Metabolic regulation by SIRT3: implications for tumorigenesis.
Finley LW, Haigis MC. Finley LW, et al. Trends Mol Med. 2012 Sep;18(9):516-23. doi: 10.1016/j.molmed.2012.05.004. Epub 2012 Jun 27. Trends Mol Med. 2012. PMID: 22749020 Free PMC article. Review. - Metabolic/hypoxial axis predicts tamoxifen resistance in breast cancer.
Azzam HN, El-Derany MO, Wahdan SA, Faheim RM, Helal GK, El-Demerdash E. Azzam HN, et al. Sci Rep. 2022 Sep 27;12(1):16118. doi: 10.1038/s41598-022-19977-w. Sci Rep. 2022. PMID: 36167713 Free PMC article.
References
- Adler V, Yin Z, Tew KD, Ronai Z. Role of redox potential and reactive oxygen species in stress signaling. Oncogene. 1999;18:6104–6111. - PubMed
- Bakker WJ, Harris IS, Mak TW. FOXO3a is activated in response to hypoxic stress and inhibits HIF1-induced apoptosis via regulation of CITED2. Mol Cell. 2007;28:941–953. - PubMed
- Bellizzi D, Rose G, Cavalcante P, Covello G, Dato S, De Rango F, et al. A novel VNTR enhancer within the SIRT3 gene, a human homologue of SIR2, is associated with survival at oldest ages. Genomics. 2005;85:258–263. - PubMed
Publication types
MeSH terms
Substances
LinkOut - more resources
Full Text Sources
Other Literature Sources
Research Materials
