Genome-wide and phase-specific DNA-binding rhythms of BMAL1 control circadian output functions in mouse liver - PubMed (original) (raw)
Genome-wide and phase-specific DNA-binding rhythms of BMAL1 control circadian output functions in mouse liver
Guillaume Rey et al. PLoS Biol. 2011 Feb.
Abstract
The mammalian circadian clock uses interlocked negative feedback loops in which the heterodimeric basic helix-loop-helix transcription factor BMAL1/CLOCK is a master regulator. While there is prominent control of liver functions by the circadian clock, the detailed links between circadian regulators and downstream targets are poorly known. Using chromatin immunoprecipitation combined with deep sequencing we obtained a time-resolved and genome-wide map of BMAL1 binding in mouse liver, which allowed us to identify over 2,000 binding sites, with peak binding narrowly centered around Zeitgeber time 6. Annotation of BMAL1 targets confirms carbohydrate and lipid metabolism as the major output of the circadian clock in mouse liver. Moreover, transcription regulators are largely overrepresented, several of which also exhibit circadian activity. Genes of the core circadian oscillator stand out as strongly bound, often at promoter and distal sites. Genomic sequence analysis of the sites identified E-boxes and tandem E1-E2 consensus elements. Electromobility shift assays showed that E1-E2 sites are bound by a dimer of BMAL1/CLOCK heterodimers with a spacing-dependent cooperative interaction, a finding that was further validated in transactivation assays. BMAL1 target genes showed cyclic mRNA expression profiles with a phase distribution centered at Zeitgeber time 10. Importantly, sites with E1-E2 elements showed tighter phases both in binding and mRNA accumulation. Finally, analyzing the temporal profiles of BMAL1 binding, precursor mRNA and mature mRNA levels showed how transcriptional and post-transcriptional regulation contribute differentially to circadian expression phase. Together, our analysis of a dynamic protein-DNA interactome uncovered how genes of the core circadian oscillator crosstalk and drive phase-specific circadian output programs in a complex tissue.
Conflict of interest statement
The authors have declared that no competing interests exist.
Figures
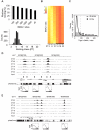
Figure 1. Time-resolved BMAL1 ChIP-Seq in mouse liver.
(A) Top panel: Fraction of rhythmic BMAL1 sites in different subgroups. Sites were ranked according to binding strength using total number of tags over all the time points. Subgroups include all sites up to the indicated ranking. Lower panel: Histogram of binding phases peaks between ZT4 and ZT8. (B) Temporal profiles of BMAL1 binding ordered by phase. Only rhythmic profiles are plotted (Fisher test, p<0.05; see Materials and Methods). (C) Histogram of number of tags in BMAL1 binding sites for all sites (black curve) and a group of RCGs (grey bars), 63% of which (26 out of 41) are above the 95% quantile shown by the vertical dashed line. The RCGs include Per1/2/3, Cry1/2, Dec1/2, Rev-Erbα/β, _Ror_α/γ, E4bp4, and Hlf/Tef/Dbp, and show 41 binding sites all together. (D) BMAL1 ChIP-Seq data at the Dbp locus (visualized in the UCSC Genome Browser) show three rhythmic binding sites located at the promoter, in the first intron, and in the second intron. Notably, these overlap with DNase I hypersensitive sites , shown by the black arrows. The panels below show quantifications of BMAL1 binding. The scale is in number of non-redundant tags per 10 million mapped tags (see Materials and Methods). The PhastCons conservation score measures phylogenetic conservation among 20 placental mammals . (E) UCSC Genome Browser view of BMAL1 ChIP-Seq data at the _Rev-Erb_α locus, showing two circadian binding sites close to its promoter and one upstream (−8 kb) site.
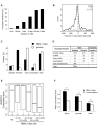
Figure 2. Genomic location and conservation of BMAL1 sites.
(A) Cumulative distribution of BMAL1 site positions relative to the closest annotated Ensembl TSSs show that 40% of all sites are within 1 kb of a TSS. (B) Histogram of BMAL1 site positions, showing that BMAL1 sites cluster near TSSs, with a maximal density near −100 bp. No clustering is found near gene 3′ ends. (C) Positioning of BMAL1 sites near coding genes. Sites were assigned according to the following definitions: promoter (site is within ±2 kb of an annotated TSS), upstream (−10 kb to −2 kb), gene (+2 kb to the polyadenylation site), downstream (polyadenylation site to +10 kb), and other (not in any of the four previous classes). The fractions expected from the respective sizes of the classes in the genome show that BMAL1 sites are mostly overrepresented in promoters and depleted inside genes. (D) Number of sites in close proximity (<10 kb) to annotated features, including non-coding RNAs (ncRNAs). These are split in micro RNAs (miRNAs) and others (long intergenic non-coding RNAs, small nucleolar RNAs, ribosomal RNAs, small nuclear RNAs, and miscellaneous RNAs). Middle column: fraction of sites from each category; last column: background fraction from the Ensembl annotation. The vast majority of sites (83%) are near genes expressed in liver (see Materials and Methods). (E) Strong BMAL1 binding correlates with high phylogenetic conservation. Sites are ranked according to the number of tags at their peak binding, and all Ensembl TSSs are shown as controls. In the window of ±50 bp around each site, the maximal value of the placental mammals PhastCons conservation score is used. PhastCons score ranges from 0 (no conservation) to 1 (perfect conservation). (F) Mean PhastCons conservation score for three classes of sites: 41 sites in RCGs (defined in Figure 1C), proximal sites (within 1 kb of an annotated Ensembl feature, 709 sites), and distal sites (1,340 sites). All categories are significantly more conserved than control regions (+500 bp downstream of each site). ***, p<1×10⁻⁶, Student's t test.
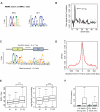
Figure 3. Genomic sequence preference of BMAL1 binding sites.
(A) Overrepresented motifs found using MEME . DNA sequences in the window of ±50 bp around each BMAL1 site were used for the sequence analysis. The enrichment of Sp1 sites reflects the proximity of BMAL1 sites to TSSs (Figure 2B). (B) Autocorrelation analysis shows that E-box motifs come in tandem, with a spacing of six or seven nucleotides. Grey dashed lines represent the 95% confidence interval. (C) HMM for the tandem E-box motif (E1-E2 element) converges to one canonical E-box site with threshold at 7.2 bits and a tandem E1-E2 element with threshold at 10.2 bits (Table S5). To train the model, each sequence was given a weight proportional to the number of BMAL1 tags at peak binding. (D) Distribution of distances from E1-E2 positions to peak centers. The E1-E2 elements are sharply located around the inferred binding location. (E) Sites with E1-E2 elements have significantly more tags (left) and show more robust rhythmic binding of BMAL1 (right) than sites without E-boxes (Ø) or with single E-boxes (E1). ***, p<5×10⁻⁵, Student's t test. (F) BMAL1 sites are strongly enriched in E1-E2 instances compared to control regions. Control regions were taken 500 bp downstream of each site.
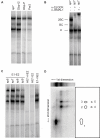
Figure 4. E1-E2 tandem sites are bound by dimers of BMAL1/CLOCK heterodimers.
(A) EMSA gel analysis with nuclear extract from mouse livers harvested at the ZT2 time point. Extracts are incubated with oligonucleotides containing the naturally occurring E1-E2 sites in the Dbp promoter (Dbp-P), Dbp intron 2 (Dbp-I2), the Per2 promoter (Per2), and an oligonucleotide with a canonical E-box (E1, CACGTG) and a non-canonical E-box (E2, AACGTG) spaced by seven nucleotides (sp7). Note: the shifts for the Dbp-I2 and sp7 probes are very similar. (B) Supershifts with anti-CLOCK and anti-BMAL1 antibodies identify two CLOCK- and BMAL1-containing complexes termed 2BC (heavier) and BC (intermediate weight), plus one unspecific complex (U, lowest weight). (C) Increased spacing and mutants. The upper 2BC band is reduced as the spacing between the E1 and E2 sites is increased from 6 bp (sp6) to 9 bp (sp9), the latter showing a pattern that resembles that obtained by mutating the E2-box but leaving E1 intact (E1-mE2). Mutating the canonical E-box (mE1-E2) strongly suppresses all complexes, while the doubly mutated probe (mE1-mE2) shows no binding. (D) Two-dimensional EMSA. The ZT2 extracts were incubated with sp7 oligonucleotides prepared with azido-dUTP nucleotides, and separated on a 1D EMSA gel (first dimension) (see Materials and Methods). The same three bands are found as in (A–C), and the weaker 2BC band compared to the regular probes (without the azido nucleotides) reflects reduced affinity following the azido substitutions in the E-box sites. In the second dimension, the five main spots indicate that the U complex contains one DNA-binding protein (spot 1), while the BC and 2BC complexes show identical DNA-binding constituents, namely CLOCK (96 kDa, spots 3 and 5) and BMAL1 (70 kDa, spots 2 and 4), as inferred by their approximate molecular mass.
Figure 5. E1-E2 sites show increased transactivation compared to only E1 sites or E1-E2 sequences with longer spacers.
(A) BMAL1-bound E1-E2 sites in the second intron of Dbp (Dbp-I2) and at the promoter of Per2 show an increased BMAL1/CLOCK transactivation compared to either the E2-mutated (E1-mE2) version or the 10-bp spacer version (sp10) (Student's one-tailed t test, p<0.05, n = 3). Empty vector (Prom[−]) is shown as a negative control. Wild-type (WT) levels are set to 100%. Error bars represent the standard error of the mean. (B) Mutation in the Dbp-I2 sequence shows that an E1 is needed for robust BMAL1/CLOCK transactivation. The wild-type version was compared to E1 mutated (mE1-E2), both E1 and E2 mutated (mE1-mE2), E2 replaced by E1 (E1-E1), and E1 replaced by E2 (E2-E2). All mutated versions have reduced activity compared to wild-type (p<0.005, n = 4), with the exception of E1-E1, which shows a level of transactivation similar to that of wild-type. (C) Modifying the spacer length of the Dbp-I2 tandem E-boxes from 4 bp to 20 bp shows a spacer preference at 6–8 bp, but also at 17 bp, which corresponds to a full helical turn of the DNA. Indeed, sp4, sp10, and sp20 have a significantly reduced activity compared to sp7 (p<0.01, n = 4).
Figure 6. mRNA expression profiles of BMAL1 targets.
(A) BMAL1 targets are highly enriched for robustly cycling mRNAs. Distribution of –log10 (_p_-value) are shown for all genes (black), liver-specific genes (see Materials and Methods) (grey), and BMAL1 targets (red). The vertical dashed line represents p = 0.05. Expression data are from mouse liver light-dark time course data . BMAL1 sites were annotated with the closest protein-coding transcript in Ensembl within a window of 10 kb. (B) Strong BMAL1 binding is associated with circadian mRNA accumulation. The sites are ranked according to their strength, and the fraction of robustly circadian mRNA patterns (Fisher test, p<0.05; see Materials and Methods) among the top x sites is shown. This fraction decreases from 100% among the top 10 sites to 29% for all sites, and this proportion is practically unchanged (31%) if we restrict our analysis to only rhythmic BMAL1 sites. (C) The distribution of the phase of cytosolic mRNA expression of targets of BMAL1 peaks at ZT10-ZT12. (D) BMAL1 targets with an E1-E2 element show narrower mRNA phase distribution than targets with no or single E-boxes (Rao homogeneity test for circular data , _p_[equality of dispersions]<0.01). E1-E2-6 and E1-E2-7 represent, respectively, the subgroup of E1-E2 sites with a spacer of 6 bp and 7 bp.
Figure 7. Phase relationships between BMAL1 binding, pre-mRNA, and mRNA accumulation.
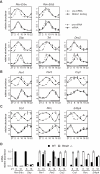
(A–C) BMAL1 binding profiles (filled symbols, upper panels) in comparison to qPCR measurement on pre-mRNA (open symbols) and mRNA (filled symbols, lower panels). The clock genes are separated into three groups based on the difference of phase of pre-mRNA expression and BMAL1 binding. The data represent the mean ± standard deviation of three experiments. The maximal value was normalized to 1. ZT22 is plotted twice to facilitate visualization. (A) Early targets. _Rev-Erb_α, _Rev-Erb_β, Dbp, Tef, and Dec2 pre-mRNA accumulation coincides with the BMAL1 binding profile. (B) Intermediate targets. Per1, Per2, and Cry2 pre-mRNA accumulation is delayed by a few hours relative to the BMAL1 binding profile. (C) Late targets. For Cry1, _Ror_γ, and E4bp4, BMAL1 binding does not predict pre-mRNA accumulation. (D) mRNA expression levels in wild-type (WT) and Bmal1 −/− mice. Expression levels were measured at ZT6 and ZT18. The clock genes are separated into three groups as in (A–C). Early targets are likely to be controlled directly and only by BMAL1 since their mRNA levels are low both at ZT6 and ZT18 in Bmal1 −/− mice. Intermediate and late targets have either intermediate or elevated mRNA levels in Bmal1 −/− mice, suggesting more complex transcriptional regulation. The data were analyzed as in (A–C).
Figure 8. Cooperative interactions drive strong circadian amplitudes: a hypothetical model.
BMAL1 rhythmically binds thousands of sites in liver, with peak binding around ZT6. Among the targets, core oscillator genes stand out as the strongest and often exhibit multiple BMAL1 binding sites. E1-E2 elements favor strong binding and precise phase-specific gene expression. The many weaker sites are distributed among clock output programs in liver, notably carbohydrate and lipid metabolism. A hypothesis for the differential binding and circadian amplitude of mRNA outputs between core oscillator genes and clock outputs is that strong sites use cooperative interactions with other regulators, or between multiple BMAL1 sites.
Similar articles
- Usf1, a suppressor of the circadian Clock mutant, reveals the nature of the DNA-binding of the CLOCK:BMAL1 complex in mice.
Shimomura K, Kumar V, Koike N, Kim TK, Chong J, Buhr ED, Whiteley AR, Low SS, Omura C, Fenner D, Owens JR, Richards M, Yoo SH, Hong HK, Vitaterna MH, Bass J, Pletcher MT, Wiltshire T, Hogenesch J, Lowrey PL, Takahashi JS. Shimomura K, et al. Elife. 2013 Apr 9;2:e00426. doi: 10.7554/eLife.00426. Elife. 2013. PMID: 23580255 Free PMC article. - Transcriptional regulatory logic of the diurnal cycle in the mouse liver.
Sobel JA, Krier I, Andersin T, Raghav S, Canella D, Gilardi F, Kalantzi AS, Rey G, Weger B, Gachon F, Dal Peraro M, Hernandez N, Schibler U, Deplancke B, Naef F; CycliX consortium. Sobel JA, et al. PLoS Biol. 2017 Apr 17;15(4):e2001069. doi: 10.1371/journal.pbio.2001069. eCollection 2017 Apr. PLoS Biol. 2017. PMID: 28414715 Free PMC article. - Prediction of mammalian tissue-specific CLOCK-BMAL1 binding to E-box DNA motifs.
Marri D, Filipovic D, Kana O, Tischkau S, Bhattacharya S. Marri D, et al. Sci Rep. 2023 May 12;13(1):7742. doi: 10.1038/s41598-023-34115-w. Sci Rep. 2023. PMID: 37173345 Free PMC article. - The Circadian Clock, Nutritional Signals and Reproduction: A Close Relationship.
Ono M, Ando H, Daikoku T, Fujiwara T, Mieda M, Mizumoto Y, Iizuka T, Kagami K, Hosono T, Nomura S, Toyoda N, Sekizuka-Kagami N, Maida Y, Kuji N, Nishi H, Fujiwara H. Ono M, et al. Int J Mol Sci. 2023 Jan 12;24(2):1545. doi: 10.3390/ijms24021545. Int J Mol Sci. 2023. PMID: 36675058 Free PMC article. Review. - [The roles of clock genes in obesity].
Shimba S. Shimba S. Nihon Rinsho. 2013 Feb;71(2):244-8. Nihon Rinsho. 2013. PMID: 23631200 Review. Japanese.
Cited by
- The clock gene, brain and muscle Arnt-like 1, regulates adipogenesis via Wnt signaling pathway.
Guo B, Chatterjee S, Li L, Kim JM, Lee J, Yechoor VK, Minze LJ, Hsueh W, Ma K. Guo B, et al. FASEB J. 2012 Aug;26(8):3453-63. doi: 10.1096/fj.12-205781. Epub 2012 May 18. FASEB J. 2012. PMID: 22611086 Free PMC article. - New insights into non-transcriptional regulation of mammalian core clock proteins.
Crosby P, Partch CL. Crosby P, et al. J Cell Sci. 2020 Sep 15;133(18):jcs241174. doi: 10.1242/jcs.241174. J Cell Sci. 2020. PMID: 32934011 Free PMC article. Review. - The rhythms of histones in regeneration: The epigenetic modifications determined by clock genes.
da Silveira EJD, Barros CCDS, Bottino MC, Castilho RM, Squarize C. da Silveira EJD, et al. Exp Dermatol. 2024 Jan;33(1):e15005. doi: 10.1111/exd.15005. Exp Dermatol. 2024. PMID: 38284199 Free PMC article. - BRCA1 and BRCA2 Gene Expression: Diurnal Variability and Influence of Shift Work.
Bracci M, Ciarapica V, Zabaleta ME, Tartaglione MF, Pirozzi S, Giuliani L, Piva F, Valentino M, Ledda C, Rapisarda V, Stevens RG, Santarelli L. Bracci M, et al. Cancers (Basel). 2019 Aug 9;11(8):1146. doi: 10.3390/cancers11081146. Cancers (Basel). 2019. PMID: 31405066 Free PMC article.
References
- Reppert S. M, Weaver D. R. Coordination of circadian timing in mammals. Nature. 2002;418:935–941. - PubMed
- Schibler U, Naef F. Cellular oscillators: rhythmic gene expression and metabolism. Curr Opin Cell Biol. 2005;17:223–229. - PubMed
- Levi F, Schibler U. Circadian rhythms: mechanisms and therapeutic implications. Annu Rev Pharmacol Toxicol. 2007;47:593–628. - PubMed
- Gachon F, Olela F. F, Schaad O, Descombes P, Schibler U. The circadian PAR-domain basic leucine zipper transcription factors DBP, TEF, and HLF modulate basal and inducible xenobiotic detoxification. Cell Metab. 2006;4:25–36. - PubMed
Publication types
MeSH terms
Substances
LinkOut - more resources
Full Text Sources
Other Literature Sources
Molecular Biology Databases
