Structural insights into radical generation by the radical SAM superfamily - PubMed (original) (raw)
Review
. 2011 Apr 13;111(4):2487-506.
doi: 10.1021/cr9002616. Epub 2011 Mar 3.
Affiliations
- PMID: 21370834
- PMCID: PMC5930932
- DOI: 10.1021/cr9002616
Review
Structural insights into radical generation by the radical SAM superfamily
Jessica L Vey et al. Chem Rev. 2011.
No abstract available
Figures
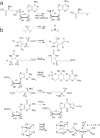
Figure 1. Radical SAM reactions
(a) The general reaction each Radical SAM enzyme catalyzes to initiate radical chemistry. (b) Selected reactions catalyzed by the Radical SAM enzymes: PFL-AE, HemN (R1 and R2 in this reaction scheme correspond to the remainder of the coproporphyrinogen III tetrapyrrole macrocycle), BioB, MoaA/MoaC, LAM TYW1 and HydE/F/G. The hydrogen atom abstracted, if known, is shown in red type. Adapted from references and.
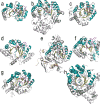
Figure 2. Ribbon diagrams of Radical SAM enzymes
Shown are the top view of each monomer with the 4Fe-4S cluster, AdoMet and substrate, if present, in stick representation: (a) PFL-AE, (b) HemN, (c) BioB, (d) MoaA, (e) LAM, (f) phTYW1 (g) HydE and (h) ThiC. The Radical SAM core domain is colored as follows: helices, teal; strands, yellow; loops, dark grey; cluster-binding loop harboring the CX3CXϕC motif, magenta. The AdoMet, 4Fe-4S cluster and substrate atoms are colored as follows: iron, ruby; sulfur, gold; AdoMet carbons, green; substrate carbons, teal; oxygen, red, nitrogen, blue. Protein elements outside the core are colored light grey.
Figure 3. Superposition of seven Radical SAM core domains, colored as in Figure 1
Here are shown two side views of the Radical SAM cores of PFL-AE, HemN, BioB, MoaA, LAM, TYW1, and HydE, from (a) the front and (b) the back.
Figure 4. Structure based sequence alignment of the Radical SAM enzymes
The seven sequences, including both structurally characterized TYW1 sequences, are aligned with the main secondary structural elements labeled above the alignment. The Radical SAM core is highlighted in yellow (strands) and teal (helices). Residues of interest are colored as follows: the CX3CXϕC motif cysteines are in red; residues that contact AdoMet (or the TYW1 residues that are expected to contact AdoMet based on an analysis of the structures) in green; residues that contact the substrate, blue; residues that contact a cofactor, pink; and residues that contact both AdoMet and the substrate, orange. For clarity and with the exception of PFL-AE, each sequence was truncated as follows: HemN (33 – 331), BioB (23 – 313), MoaA (1 – 285), LAM (96 – 381), phTYW1 (30 – 342), mjTYW1 (30 – 311) and HydE (35 – 335). Residues of the four motifs (see text) are boxed in red and identified as follows: red stars correspond to the cysteines of the cluster-binding loop; red circles, the GGE motif; red triangles, the GxIxGxxE motif; and red squares, the conserved structural motif. A previously published alignment was used as a starting point for this alignment. It was then adjusted manually to reflect the exact structural elements of each enzyme and, in the case of the GxIxGxxE motif, to align the residues involved in conserved hydrogen bonding networks.
Figure 5. Overlay of 4Fe-4S clusters and bound AdoMet from six Radical SAM enzymes, shown in stereoview
Colors are as follows: iron, ruby; sulfur, gold; oxygen, red; nitrogen, blue. In order to distinguish the six enzymes, the AdoMet carbons of each enzyme are colored as follows: teal, PFL-AE; magenta, HemN; orange, BioB; green, MoaA; purple, LAM; grey, HydE.
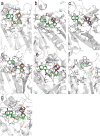
Figure 6. Details of Radical SAM enzyme AdoMet binding site
The protein backbone is shown as grey cartoons, with AdoMet and the 4Fe-4S cluster shown in sticks (AdoMet, green carbons; iron, ruby; sulfur, gold) and core β strands labeled 1 – 6. Protein sidechains that interact with AdoMet are shown as lines with carbons colored dark grey. Hydrogen bonding contacts are shown as red (within 3.2 Å distance), green (3.2 – 3.7 Å) or yellow (more than 3.7 Å) dashed lines. Shown in this figure are the AdoMet binding sites of (a) PFL-AE (b) HemN (c) BioB (d) MoaA (e) LAM (f) the putative AdoMet binding site of phTYW1, shown with the superimposed 4Fe-4S cluster and AdoMet of the MoaA structure and (g) HydE. See Figure S8 for these images in stereoview.
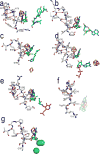
Figure 7. The GxIxGxxE motif
AdoMet and the 4Fe-4S cluster and the protein residues making up this motif are shown in sticks, colored as in Figure 6. Shown are (a) PFL-AE (b) HemN (c) BioB (d) MoaA (e) LAM (f) phTYW1 with the 4Fe-4S cluster and AdoMet of the superimposed MoaA structure (shown as transparent sticks) and (g) HydE. Note that, with the exception of BioB and HydE, the sidechain of the first residue of the motif is positioned similarly with respect to the AdoMet ribose and atom C5'. Each protein also has a similar sidechain-to-backbone hydrogen bond in the loop following β5 (shown as red dashed lines). Three bound chloride ions observed in the HydE structure are displayed as green spheres. See text for more details and Figure S9 for these images in stereoview.
Figure 8. Stereoview of the substrate binding sites of the Radical SAM enzymes
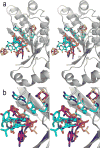
In (a), five structures with substrate bound are superimposed based on their Radical SAM cores. Shown is the Radical SAM core, 4Fe-4S cluster and AdoMet of PFL-AE only, with AdoMet carbons colored teal. The five “substrates” of the enzymes are shown in sticks, colored as follows: teal, PFL-AE; magenta, HemN; orange, BioB; green, MoaA; purple, LAM. PLP of LAM and the BioB 2Fe-2S, MoaA 4Fe-4S and HydE 2Fe-2S clusters are also shown, displayed as in other figures. In (b), five enzyme structures are superimposed on their 4Fe-4S clusters and AdoMet only, to give a more accurate comparison of the relative positions of the substrates with respect to AdoMet. The core backbone, 4Fe-4S cluster and AdoMet of PFL-AE are shown, and colors are as described in (a). C5' of AdoMet is shown as a sphere. The atoms from which hydrogen abstraction is known to occur (i.e. Cα of G734 of the peptide, C6 and C8 of dethiobiotin, and Cβ of lysine) are also shown as spheres.
Figure 9. Surface conservation of Radical SAM enzymes suggests putative binding site for physiological reductant
Shown are the cartoon representations and transparent surfaces of (a) PFL-AE, (b) HemN, (c) BioB, (d) MoaA, (e) LAM, (f) phTYW1 and (g) HydE, from the the opposite side of the partial barrel with respect to the lateral opening of the Radical SAM core, in roughly the same view as in Figure 3b. The transparent surface is colored as a rainbow according to the extent of sequence conservation with respect to the protein’s individual family, with red being 100% conserved and blue as 0% conserved. A BLAST search was conducted via the ExPASy proteomics server using the sequence of the enzyme that is structurally characterized as the query. The top matching sequences (up to 100 in number) were input for alignment by ClustalW. The alignment output by ClustalW was then used as input to ESPript, which calculated the extent of conservation of each residue. Arrows indicate proposed surface for interaction with reductant. See Figure S16 for stereoviews of each surface.
Similar articles
- The methylthiolation reaction mediated by the Radical-SAM enzymes.
Atta M, Arragain S, Fontecave M, Mulliez E, Hunt JF, Luff JD, Forouhar F. Atta M, et al. Biochim Biophys Acta. 2012 Nov;1824(11):1223-30. doi: 10.1016/j.bbapap.2011.11.007. Epub 2011 Dec 7. Biochim Biophys Acta. 2012. PMID: 22178611 Free PMC article. Review. - Radical SAM enzymes and radical enzymology.
Booker SJ. Booker SJ. Biochim Biophys Acta. 2012 Nov;1824(11):1151-3. doi: 10.1016/j.bbapap.2012.07.006. Epub 2012 Jul 22. Biochim Biophys Acta. 2012. PMID: 22850428 No abstract available. - Auxiliary iron-sulfur cofactors in radical SAM enzymes.
Lanz ND, Booker SJ. Lanz ND, et al. Biochim Biophys Acta. 2015 Jun;1853(6):1316-34. doi: 10.1016/j.bbamcr.2015.01.002. Epub 2015 Jan 15. Biochim Biophys Acta. 2015. PMID: 25597998 Review. - Reaction of AdoMet with ThiC generates a backbone free radical.
Martinez-Gomez NC, Poyner RR, Mansoorabadi SO, Reed GH, Downs DM. Martinez-Gomez NC, et al. Biochemistry. 2009 Jan 20;48(2):217-9. doi: 10.1021/bi802154j. Biochemistry. 2009. PMID: 19113839 Free PMC article. - The Elongator subunit Elp3 contains a Fe4S4 cluster and binds S-adenosylmethionine.
Paraskevopoulou C, Fairhurst SA, Lowe DJ, Brick P, Onesti S. Paraskevopoulou C, et al. Mol Microbiol. 2006 Feb;59(3):795-806. doi: 10.1111/j.1365-2958.2005.04989.x. Mol Microbiol. 2006. PMID: 16420352
Cited by
- The Atypical Cobalamin-Dependent _S_-Adenosyl-l-Methionine Nonradical Methylase TsrM and Its Radical Counterparts.
Ulrich EC, Drennan CL. Ulrich EC, et al. J Am Chem Soc. 2022 Apr 6;144(13):5673-5684. doi: 10.1021/jacs.1c12064. Epub 2022 Mar 28. J Am Chem Soc. 2022. PMID: 35344653 Free PMC article. - Posttranslational Methylation of Arginine in Methyl Coenzyme M Reductase Has a Profound Impact on both Methanogenesis and Growth of Methanococcus maripaludis.
Lyu Z, Shao N, Chou CW, Shi H, Patel R, Duin EC, Whitman WB. Lyu Z, et al. J Bacteriol. 2020 Jan 15;202(3):e00654-19. doi: 10.1128/JB.00654-19. Print 2020 Jan 15. J Bacteriol. 2020. PMID: 31740491 Free PMC article. - Targeting viperin to the mitochondrion inhibits the thiolase activity of the trifunctional enzyme complex.
Dumbrepatil AB, Zegalia KA, Sajja K, Kennedy RT, Marsh ENG. Dumbrepatil AB, et al. J Biol Chem. 2020 Feb 28;295(9):2839-2849. doi: 10.1074/jbc.RA119.011526. Epub 2020 Jan 24. J Biol Chem. 2020. PMID: 31980458 Free PMC article. - SPASM and twitch domains in S-adenosylmethionine (SAM) radical enzymes.
Grell TA, Goldman PJ, Drennan CL. Grell TA, et al. J Biol Chem. 2015 Feb 13;290(7):3964-71. doi: 10.1074/jbc.R114.581249. Epub 2014 Dec 4. J Biol Chem. 2015. PMID: 25477505 Free PMC article. Review. - A Chemoproteomic Approach to Monitor Native Iron-Sulfur Cluster Binding.
Bak DW, Weerapana E. Bak DW, et al. Methods Mol Biol. 2024;2839:261-289. doi: 10.1007/978-1-0716-4043-2_16. Methods Mol Biol. 2024. PMID: 39008260
References
- Frey PA, Magnusson OT. Chem. Rev. 2003;103:2129. - PubMed
- Frey PA. FASEB J. 1993;7:662. - PubMed
- Marquet A, Tse Sum Bui B, Smith AG, Warren MJ. Nat. Prod. Rep. 2007;24:1027. - PubMed
- Wang SC, Frey PA. Trends Biochem. Sci. 2007;32:101. - PubMed
Publication types
MeSH terms
Substances
LinkOut - more resources
Full Text Sources
