Broad epigenetic signature of maternal care in the brain of adult rats - PubMed (original) (raw)
Broad epigenetic signature of maternal care in the brain of adult rats
Patrick O McGowan et al. PLoS One. 2011.
Abstract
Background: Maternal care is associated with long-term effects on behavior and epigenetic programming of the NR3C1 (GLUCOCORTICOID RECEPTOR) gene in the hippocampus of both rats and humans. In the rat, these effects are reversed by cross-fostering, demonstrating that they are defined by epigenetic rather than genetic processes. However, epigenetic changes at a single gene promoter are unlikely to account for the range of outcomes and the persistent change in expression of hundreds of additional genes in adult rats in response to differences in maternal care.
Methodology/principal findings: We examine here using high-density oligonucleotide array the state of DNA methylation, histone acetylation and gene expression in a 7 million base pair region of chromosome 18 containing the NR3C1 gene in the hippocampus of adult rats. Natural variations in maternal care are associated with coordinate epigenetic changes spanning over a hundred kilobase pairs. The adult offspring of high compared to low maternal care mothers show epigenetic changes in promoters, exons, and gene ends associated with higher transcriptional activity across many genes within the locus examined. Other genes in this region remain unchanged, indicating a clustered yet specific and patterned response. Interestingly, the chromosomal region containing the protocadherin-α, -β, and -γ (Pcdh) gene families implicated in synaptogenesis show the highest differential response to maternal care.
Conclusions/significance: The results suggest for the first time that the epigenetic response to maternal care is coordinated in clusters across broad genomic areas. The data indicate that the epigenetic response to maternal care involves not only single candidate gene promoters but includes transcriptional and intragenic sequences, as well as those residing distantly from transcription start sites. These epigenetic and transcriptional profiles constitute the first tiling microarray data set exploring the relationship between epigenetic modifications and RNA expression in both protein coding and non-coding regions across a chromosomal locus in the mammalian brain.
Conflict of interest statement
Competing Interests: The authors have declared that no competing interests exist.
Figures
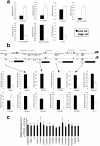
Figure 1. Microarray validation.
(a) H3K9 acetylation differences between High (white bars) and Low LG (black bars) adult offspring validated by qCHIP (see Methods). (b) (upper) DNA methylation differences between High and Low LG adult offspring detected by microarray analysis (H–L), showing gene location, and region analyzed. (lower) DNA methylation differences validated in the same manner as for H3K9 acetylation. (c) Gene expression differences between High LG and Low LG adult offspring (* = P<0.05). All real-time PCR reactions were performed in triplicate and results are displayed as mean +/− SEM.
Figure 2. The pattern of H3K9 acetylation, DNA methylation, and gene expression among High and Low LG adult offspring across ∼7MB of chromosome 18.
Tracks show CpG Islands, differences in H3K9 acetylation, DNA methylation and gene expression between High (black) and Low LG (grey) adult offspring (H–L) and the locations of known genes (red) across the chromosomal locus (see Methods S1). Highlighted regions show the location of the NR3C1 gene (green), Protocadherin gene clusters (blue) and a large mainly intergenic region (orange).
Figure 3. Regional variations in differences in histone acetylation, DNA methyation and gene expression between High and Low LG adult offspring.
(a) The Pearson correlation of DNA methylation and H3K9 acetylation differences between the High and Low LG adult offspring for pairs of probes located at varying distances from each other. Error bars show 95% confidence intervals for the correlation values. Grey highlight shows the 95% confidence interval for correlations obtained from randomly selected probe pairs. (b) Enrichment of RDme (Regional Differences in DNA methylation) between High and Low LG adult offspring across all genes from the 5′ region to the 3′ region. Enrichment is quantified as increased frequency of RDme in a given gene region (number of RDme/bp). Significance is the quantile of this enrichment with respect to the distribution of randomly positioned RDme. A quantile above 0.975 indicates significant enrichment, and a quantile below 0.025 indicates significant depletion at the P = 0.05 level. Quantiles of hyperacetylated RDac/hypermethylated RDme in High compared to Low LG offspring (red) and quantiles of hypoacetylated RDac/hypomethylated RDme (blue) are shown. (c) Mean differences across all probes in DNA methylation, H3K9 acetylation and RNA expression levels between High LG and Low LG adult offspring are shown across all genes from the 5′ region to the 3′ region, with significant differences indicated by non-zero values. Line thickness denotes SEM.
Figure 4. Epigenomic neighborhood of the glucocorticoid receptor gene.
(a) Track of the glucocorticoid receptor gene, NR3C1, showing examples of large RDme/ac throughout the 5′ end and intron of the gene. Individual tracks, from the top to the bottom, show locations of hyperacetylated (blue) and hypoacetylated (yellow) RDac in High relative to Low LG adult offspring, RDme displayed in the same manner, mean gene expression, and the location of the NR3C1 gene. (b) Schematic representation splice variant assembly of 5′ untranslated elements as well as the first coding exon (GR2) of the NR3C1 gene, along with gene expression differences between High and Low LG adult offspring (* = P<0.05). Each real-time PCR reaction was performed in triplicate and results are displayed as mean +/− SEM.
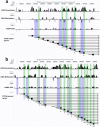
Figure 5. Epigenomic neighborhoods of the first exons in protocadherin gene clusters.
Genes with hypomethylated 5′ gene ends (blue), hypermethylated and hyperacetylated exons (green) and significantly greater gene expression among High compared to Low LG adult offspring (H–L) are shown for (a) protocadherin-α, (b) protocadherin-γ gene clusters. Gene expression differences of genes surveyed by quantitative RT-PCR (filled boxes; ** = P<0.01, * = P<0.05) are shown relative to the location of other nearby Pcdh genes within each cluster (unfilled boxes).
Similar articles
- Variations in postnatal maternal care and the epigenetic regulation of metabotropic glutamate receptor 1 expression and hippocampal function in the rat.
Bagot RC, Zhang TY, Wen X, Nguyen TT, Nguyen HB, Diorio J, Wong TP, Meaney MJ. Bagot RC, et al. Proc Natl Acad Sci U S A. 2012 Oct 16;109 Suppl 2(Suppl 2):17200-7. doi: 10.1073/pnas.1204599109. Epub 2012 Oct 8. Proc Natl Acad Sci U S A. 2012. PMID: 23045678 Free PMC article. - Natural variation in maternal care and cross-tissue patterns of oxytocin receptor gene methylation in rats.
Beery AK, McEwen LM, MacIsaac JL, Francis DD, Kobor MS. Beery AK, et al. Horm Behav. 2016 Jan;77:42-52. doi: 10.1016/j.yhbeh.2015.05.022. Epub 2015 Jun 27. Horm Behav. 2016. PMID: 26122287 Free PMC article. - Conserved epigenetic sensitivity to early life experience in the rat and human hippocampus.
Suderman M, McGowan PO, Sasaki A, Huang TC, Hallett MT, Meaney MJ, Turecki G, Szyf M. Suderman M, et al. Proc Natl Acad Sci U S A. 2012 Oct 16;109 Suppl 2(Suppl 2):17266-72. doi: 10.1073/pnas.1121260109. Epub 2012 Oct 8. Proc Natl Acad Sci U S A. 2012. PMID: 23045659 Free PMC article. - Environmental programming of stress responses through DNA methylation: life at the interface between a dynamic environment and a fixed genome.
Meaney MJ, Szyf M. Meaney MJ, et al. Dialogues Clin Neurosci. 2005;7(2):103-23. doi: 10.31887/DCNS.2005.7.2/mmeaney. Dialogues Clin Neurosci. 2005. PMID: 16262207 Free PMC article. Review. - Maternal programming of steroid receptor expression and phenotype through DNA methylation in the rat.
Szyf M, Weaver IC, Champagne FA, Diorio J, Meaney MJ. Szyf M, et al. Front Neuroendocrinol. 2005 Oct-Dec;26(3-4):139-62. doi: 10.1016/j.yfrne.2005.10.002. Epub 2005 Nov 21. Front Neuroendocrinol. 2005. PMID: 16303171 Review.
Cited by
- Epigenetic mechanisms for the early environmental regulation of hippocampal glucocorticoid receptor gene expression in rodents and humans.
Zhang TY, Labonté B, Wen XL, Turecki G, Meaney MJ. Zhang TY, et al. Neuropsychopharmacology. 2013 Jan;38(1):111-23. doi: 10.1038/npp.2012.149. Epub 2012 Sep 12. Neuropsychopharmacology. 2013. PMID: 22968814 Free PMC article. Review. - Environmental influences on the female epigenome and behavior.
Keller SM, Roth TL. Keller SM, et al. Environ Epigenet. 2016 Apr;2(2):dvw007. doi: 10.1093/eep/dvw007. Epub 2016 Jul 4. Environ Epigenet. 2016. PMID: 27746953 Free PMC article. - Looking beyond the DNA sequence: the relevance of DNA methylation processes for the stress-diathesis model of depression.
Booij L, Wang D, Lévesque ML, Tremblay RE, Szyf M. Booij L, et al. Philos Trans R Soc Lond B Biol Sci. 2013 Feb 25;368(1615):20120251. doi: 10.1098/rstb.2012.0251. Print 2013. Philos Trans R Soc Lond B Biol Sci. 2013. PMID: 23440465 Free PMC article. Review. - The transgenerational transmission of childhood adversity: behavioral, cellular, and epigenetic correlates.
Gröger N, Matas E, Gos T, Lesse A, Poeggel G, Braun K, Bock J. Gröger N, et al. J Neural Transm (Vienna). 2016 Sep;123(9):1037-52. doi: 10.1007/s00702-016-1570-1. Epub 2016 May 12. J Neural Transm (Vienna). 2016. PMID: 27169537 Review. - Early life adversity alters normal sex-dependent developmental dynamics of DNA methylation.
Massart R, Nemoda Z, Suderman MJ, Sutti S, Ruggiero AM, Dettmer AM, Suomi SJ, Szyf M. Massart R, et al. Dev Psychopathol. 2016 Nov;28(4pt2):1259-1272. doi: 10.1017/S0954579416000833. Epub 2016 Sep 30. Dev Psychopathol. 2016. PMID: 27687908 Free PMC article.
References
- Kendler KS, Gardner CO, Prescott CA. Toward a comprehensive developmental model for major depression in women. Am J Psychiatry. 2002;159:1133–1145. - PubMed
- McEwen BS. Early life influences on life-long patterns of behavior and health. Ment Retard Dev Disabil Res Rev. 2003;9:149–154. - PubMed
- Nemeroff CB. Neurobiological consequences of childhood trauma. J Clin Psychiatry. 2004;65(Suppl 1):18–28. - PubMed
- Nemeroff CC. Early-Life Adversity, CRF Dysregulation, and Vulnerability to Mood and Anxiety Disorders. Psychopharmacol Bull. 2004;38:14–20. - PubMed
- Coldwell J, Pike A, Dunn J. Household chaos—links with parenting and child behaviour. J Child Psychol Psychiatry. 2006;47:1116–1122. - PubMed
Publication types
MeSH terms
Substances
LinkOut - more resources
Full Text Sources
Other Literature Sources
Molecular Biology Databases


