Netting neutrophils are major inducers of type I IFN production in pediatric systemic lupus erythematosus - PubMed (original) (raw)
. 2011 Mar 9;3(73):73ra20.
doi: 10.1126/scitranslmed.3001201.
Simone Caielli, Barbara Vega, John Connolly, Florence Allantaz, Zhaohui Xu, Marilynn Punaro, Jeanine Baisch, Cristiana Guiducci, Robert L Coffman, Franck J Barrat, Jacques Banchereau, Virginia Pascual
Affiliations
- PMID: 21389264
- PMCID: PMC3143837
- DOI: 10.1126/scitranslmed.3001201
Netting neutrophils are major inducers of type I IFN production in pediatric systemic lupus erythematosus
Gina S Garcia-Romo et al. Sci Transl Med. 2011.
Abstract
Systemic lupus erythematosus (SLE) is a systemic autoimmune disease characterized by a breakdown of tolerance to nuclear antigens and the development of immune complexes. Genomic approaches have shown that human SLE leukocytes homogeneously express type I interferon (IFN)-induced and neutrophil-related transcripts. Increased production and/or bioavailability of IFN-α and associated alterations in dendritic cell (DC) homeostasis have been linked to lupus pathogenesis. Although neutrophils have long been shown to be associated with lupus, their potential role in disease pathogenesis remains elusive. Here, we show that mature SLE neutrophils are primed in vivo by type I IFN and die upon exposure to SLE-derived anti-ribonucleoprotein antibodies, releasing neutrophil extracellular traps (NETs). SLE NETs contain DNA as well as large amounts of LL37 and HMGB1, neutrophil proteins that facilitate the uptake and recognition of mammalian DNA by plasmacytoid DCs (pDCs). Indeed, SLE NETs activate pDCs to produce high levels of IFN-α in a DNA- and TLR9 (Toll-like receptor 9)-dependent manner. Our results reveal an unsuspected role for neutrophils in SLE pathogenesis and identify a novel link between nucleic acid-recognizing antibodies and type I IFN production in this disease.
Figures
Fig. 1
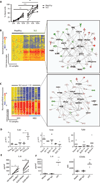
SLE neutrophils are prone to death and display prominent signatures of type I IFN, TLR signaling, and cell death. (A) Healthy (n = 11) and SLE (n = 11) neutrophils were cultured with 2% autologous serum (AS). Cell viability was evaluated at different time points using trypan blue. ***P < 0.0001, ANOVA (adjusted for Dunn’s test). (**B**) Microarray analysis of purified blood neutrophils from healthy children (_n_ = 12) and pediatric SLE patients (_n_ = 21). One thousand five hundred and sixty-four transcripts were differentially expressed in SLE neutrophils (_P_ < 0.01, nonparametric _t_ test). Genes representative of the three most prominent pathways according to Ingenuity Pathways Analysis algorithms are shown. (**C**) Microarray analysis of neutrophils from two healthy donors (HD1 and HD2) incubated for 6 hours with either 20% AS or sera from 10 pediatric SLE patients. Data were normalized to autologous sera cultures. Genes from the three most representative networks according to Ingenuity Pathways Analysis algorithm are depicted. (**D**) Healthy neutrophils were cultured with 20% AS or sera from four pediatric SLE patients (SLES) with active disease (SLEDAI > 4). TLR7, TLR8, and TLR9 expression was analyzed using real-time PCR. Fold up-regulation was calculated as the difference in cycle threshold after 1- and 6-hour in vitro incubation relative to the expression at time 0. (E) Neutrophils from healthy children (HN, n = 6) and SLE patients (SLEN, n = 7) were cultured overnight in the presence or absence of a TLR7 agonist (R837, 10 µg/ml). IL-8 production was analyzed by Luminex assay. ***P < 0.0001, paired t test. (F) SLE neutrophils (n = 4) were incubated with media, anti-RNP antibody (10 µg/ml), or LPS (25 nM) for 6 hours. Left: IL-8 production was detected by Luminex. Right: cells were stained for CD66b surface expression. Results are displayed as quantification of mean fluorescence intensity (MFI). **P = 0.001; ***P < 0.0001, ANOVA (adjusted for Dunn’s test).
Fig. 2
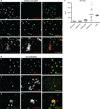
Anti-RNP antibodies induce NETosis of SLE neutrophils. (A and B) Neutrophils from healthy children (A) and SLE patients (B) were stained with calcein green. Cells were incubated in 2% AS for 3 hours (A and B, a and b) and treated with anti-RNP IgG (10 µg/ml) (A and B, d to f) or with PMA (25 nm) (A and B, g to i). Sytox Red was used to stain DNA and detect cell death. Neutrophils from healthy children display intact membranes after 3 hours of culture with medium (A, a to c). Under the same conditions, SLE neutrophils undergo significant apoptosis (B, a to c). Anti-RNP antibodies induce apoptosis of healthy neutrophils (A, d to f) and NETosis of SLE neutrophils (B, d to f). PMA induces the release of extracellular DNA in both healthy (A, g to i) and SLE (B, g to i) neutrophils. These data are representative of at least six independent experiments. (C) NET DNA quantification. Supernatants from healthy and SLE neutrophils with and without previous activation with anti-RNP antibodies were digested with micrococcal nuclease to dismantle the NET scaffold. Free DNA in the supernatants was quantified by incubation with Sytox Orange followed by relative fluorescence measurement after building a standard curve using λ DNA. As a positive control, NETs were induced by incubating neutrophils with PMA (25 nm) for 12 hours. *P = 0.01, one-way ANOVA with post test Dunn’s correction.
Fig. 3
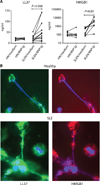
SLE NETs are loaded with LL37 and HMGB1. (A) Activation with anti-RNP antibodies leads SLE, but not healthy neutrophils, to secrete high levels of LL37 (left) and HMGB1 (right) as quantified by ELISA on culture supernatants (P values were obtained by paired t test). (B) LL37 and HMGB1 colocalize following a globular pattern along SLE NETs. NET release was triggered by treating healthy and SLE neutrophils with PMA (25 nM) for 3 hours. Specimens were then fixed and incubated with antibodies against LL37 and HMGB1 followed by the addition of FITC- or TRITC-conjugated secondary Fab fragments, respectively. DNA was counterstained with Hoechst 33342. Magnification, ×40. This experiment is representative of four independent experiments.
Fig. 4
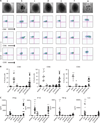
SLE NETs induced by anti-RNP antibodies are potent activators of pDCs. (A) pDCs from healthy donors were cultured with medium (a), CpG A (10 µg/ml) (b), anti-RNP IgG (10 µg/ml) (c), supernatant (20%) from healthy neutrophils without (d) or with (e) activation with anti-RNP IgG, and supernatant (20%) from SLE neutrophils without (f) or with (g) activation with anti-RNP IgG (10 µg/ml). Top panel depicts the light microscopy images after overnight culture under the above-described conditions. Expression of HLA-DR, CD80, CD86, and CD83 was assessed by flow cytometry in the same cultures (gated on live cells). (B) These experiments were repeated using 3 independent healthy pDC donors and 17 SLE sera for induction of CD80 and CD86 expression and 13 sera for induction of CD83 expression. ***P < 0.0001, one-way ANOVA with post test Dunn’s correction. (C) Cytokine measurement in the supernatants of pDCs activated as described in (A). ***P < 0.0001, one-way ANOVA with post test Dunn’s correction.
Fig. 5
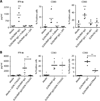
Mechanism underlying the generation of anti-RNP antibody–induced SLE NETs and their downstream effects on pDCs. (A) Neutrophils from SLE patients (n = 4) were pretreated for 10 min with FcγRIIa blocker (anti-human CD32), the NADPH oxidase inhibitor diphenylene iodonium (DPI) (left and middle panels), or the TLR7 inhibitor IRS-661 (right panel) before incubation with anti-RNP antibodies. Neutrophil supernatants were then added to pDC cultures. IFN-α secretion (left) and expression of the maturation marker CD83 (middle and right panels) were assessed by Luminex and flow cytometry, respectively. HG IgG, heat-aggregated Ig control. *P = 0.01; ***P < 0.0001, one-way ANOVA with post test Dunn’s correction. (B) Addition of TLR9 inhibitors (ODN-TTAGGG) or DNase I inhibits the capacity of SLE NETs to induce pDC activation as measured by IFN-α secretion (left) and CD83 expression (right), respectively; ODN-TTAGGG did not inhibit NET-induced pDC maturation (middle). **P = 0.001, paired t test.
Fig. 6
Treatment of healthy neutrophils with IFN-α renders them susceptible to NETosis upon subsequent activation with anti-RNP antibodies. pDCs were cultured in the presence of medium, CpG A (10 µg/ml), anti-RNP IgG (10 µg/ml), supernatants (20%) from healthy neutrophils (HN/ctrl), healthy neutrophils treated with anti-RNP IgG (HN/RNP), or IFN-α (1000 IU, HN–IFN-α) or from healthy neutrophils treated for 6 hours with IFN-α; washed; and incubated with anti-RNP IgG (HN–IFN-α/RNP). (A) Flow cytometry was used to assess induction of expression of activation markers (CD80, CD86, CD83) after overnight cultures. (B) Luminex assay was used to assess secretion of IFN-α, TNF-α, and IL-6 in the same cultures. *P = 0.01; ***P < 0.0001, one-way ANOVA with post test Dunn’s correction.
Comment in
- Dissecting the immune cell mayhem that drives lupus pathogenesis.
Craft JE. Craft JE. Sci Transl Med. 2011 Mar 9;3(73):73ps9. doi: 10.1126/scitranslmed.3002138. Sci Transl Med. 2011. PMID: 21389262 Free PMC article. - TRAPping the cellular mechanisms of lupus.
Bosch X. Bosch X. EMBO Mol Med. 2011 Oct;3(10):578-80. doi: 10.1002/emmm.201100167. Epub 2011 Sep 9. EMBO Mol Med. 2011. PMID: 21905225 Free PMC article. No abstract available.
Similar articles
- Neutrophil Extracellular Trap Mitochondrial DNA and Its Autoantibody in Systemic Lupus Erythematosus and a Proof-of-Concept Trial of Metformin.
Wang H, Li T, Chen S, Gu Y, Ye S. Wang H, et al. Arthritis Rheumatol. 2015 Dec;67(12):3190-200. doi: 10.1002/art.39296. Arthritis Rheumatol. 2015. PMID: 26245802 Clinical Trial. - Neutrophils activate plasmacytoid dendritic cells by releasing self-DNA-peptide complexes in systemic lupus erythematosus.
Lande R, Ganguly D, Facchinetti V, Frasca L, Conrad C, Gregorio J, Meller S, Chamilos G, Sebasigari R, Riccieri V, Bassett R, Amuro H, Fukuhara S, Ito T, Liu YJ, Gilliet M. Lande R, et al. Sci Transl Med. 2011 Mar 9;3(73):73ra19. doi: 10.1126/scitranslmed.3001180. Sci Transl Med. 2011. PMID: 21389263 Free PMC article. - Coordination between innate immune cells, type I IFNs and IRF5 drives SLE pathogenesis.
Matta B, Barnes BJ. Matta B, et al. Cytokine. 2020 Aug;132:154731. doi: 10.1016/j.cyto.2019.05.018. Epub 2019 May 23. Cytokine. 2020. PMID: 31130331 Free PMC article. Review. - Circulating Apoptotic Microparticles in Systemic Lupus Erythematosus Patients Drive the Activation of Dendritic Cell Subsets and Prime Neutrophils for NETosis.
Dieker J, Tel J, Pieterse E, Thielen A, Rother N, Bakker M, Fransen J, Dijkman HB, Berden JH, de Vries JM, Hilbrands LB, van der Vlag J. Dieker J, et al. Arthritis Rheumatol. 2016 Feb;68(2):462-72. doi: 10.1002/art.39417. Arthritis Rheumatol. 2016. PMID: 26360137 - A compass that points to lupus: genetic studies on type I interferon pathway.
Kyogoku C, Tsuchiya N. Kyogoku C, et al. Genes Immun. 2007 Sep;8(6):445-55. doi: 10.1038/sj.gene.6364409. Epub 2007 Jun 21. Genes Immun. 2007. PMID: 17581625 Review.
Cited by
- Serum extracellular traps associate with the activation of myeloid cells in SLE patients with the low level of anti-DNA antibodies.
Hanata N, Ota M, Tsuchida Y, Nagafuchi Y, Okamura T, Shoda H, Fujio K. Hanata N, et al. Sci Rep. 2022 Nov 1;12(1):18397. doi: 10.1038/s41598-022-23076-1. Sci Rep. 2022. PMID: 36319843 Free PMC article. - Elevated neutrophil extracellular traps in systemic sclerosis-associated vasculopathy and suppression by a synthetic prostacyclin analog.
Kortam N, Liang W, Shiple C, Huang S, Gedert R, Clair JS, Sarosh C, Foster C, Tsou PS, Varga J, Knight JS, Khanna D, Ali RA. Kortam N, et al. Arthritis Res Ther. 2024 Jul 25;26(1):139. doi: 10.1186/s13075-024-03379-6. Arthritis Res Ther. 2024. PMID: 39054558 Free PMC article. - The clinical features and potential mechanisms of cognitive disorders in peripheral autoimmune and inflammatory diseases.
Fan KQ, Huang T, Yu JS, Li YY, Jin J. Fan KQ, et al. Fundam Res. 2022 Dec 24;4(2):226-236. doi: 10.1016/j.fmre.2022.12.005. eCollection 2024 Mar. Fundam Res. 2022. PMID: 38933510 Free PMC article. Review. - Neutrophil degranulation and severely impaired extracellular trap formation at the basis of susceptibility to infections of hemodialysis patients.
Talal S, Mona K, Karem A, Yaniv L, Reut HM, Ariel S, Moran AK, Harel E, Campisi-Pinto S, Mahmoud AA, Raul C, David T, Gil BS, Idan C. Talal S, et al. BMC Med. 2022 Oct 26;20(1):364. doi: 10.1186/s12916-022-02564-1. BMC Med. 2022. PMID: 36284314 Free PMC article. - A NET Outcome.
Lu T, Kobayashi SD, Quinn MT, Deleo FR. Lu T, et al. Front Immunol. 2012 Dec 5;3:365. doi: 10.3389/fimmu.2012.00365. eCollection 2012. Front Immunol. 2012. PMID: 23227026 Free PMC article.
References
- Lahita RG. Systemic Lupus Erythematosus. ed. 3. San Diego: Academic Press; 1999.
- Wakeland EK, Liu K, Graham RR, Behrens TW. Delineating the genetic basis of systemic lupus erythematosus. Immunity. 2001;15:397–408. - PubMed
- Rozzo SJ, Allard JD, Choubey D, Vyse TJ, Izui S, Peltz G, Kotzin BL. Evidence for an interferon-inducible gene, Ifi202, in the susceptibility to systemic lupus. Immunity. 2001;15:435–443. - PubMed
- Pascual V, Banchereau J, Palucka AK. The central role of dendritic cells and interferon-α in SLE. Curr. Opin. Rheumatol. 2003;15:548–556. - PubMed
- Blanco P, Palucka AK, Gill M, Pascual V, Banchereau J. Induction of dendritic cell differentiation by IFN-α in systemic lupus erythematosus. Science. 2001;294:1540–1543. - PubMed
Publication types
MeSH terms
Substances
Grants and funding
- R01-CA078846/CA/NCI NIH HHS/United States
- R01 AR050770/AR/NIAMS NIH HHS/United States
- U19-A1057234/PHS HHS/United States
- U19 AI057234/AI/NIAID NIH HHS/United States
- U19-AI082715-01/AI/NIAID NIH HHS/United States
- R01 CA078846/CA/NCI NIH HHS/United States
- P50 AR054083/AR/NIAMS NIH HHS/United States
- ARO55503-01/PHS HHS/United States
- U19 AI082715/AI/NIAID NIH HHS/United States
LinkOut - more resources
Full Text Sources
Other Literature Sources
Medical
Molecular Biology Databases
