A circadian rhythm orchestrated by histone deacetylase 3 controls hepatic lipid metabolism - PubMed (original) (raw)
A circadian rhythm orchestrated by histone deacetylase 3 controls hepatic lipid metabolism
Dan Feng et al. Science. 2011.
Abstract
Disruption of the circadian clock exacerbates metabolic diseases, including obesity and diabetes. We show that histone deacetylase 3 (HDAC3) recruitment to the genome displays a circadian rhythm in mouse liver. Histone acetylation is inversely related to HDAC3 binding, and this rhythm is lost when HDAC3 is absent. Although amounts of HDAC3 are constant, its genomic recruitment in liver corresponds to the expression pattern of the circadian nuclear receptor Rev-erbα. Rev-erbα colocalizes with HDAC3 near genes regulating lipid metabolism, and deletion of HDAC3 or Rev-erbα in mouse liver causes hepatic steatosis. Thus, genomic recruitment of HDAC3 by Rev-erbα directs a circadian rhythm of histone acetylation and gene expression required for normal hepatic lipid homeostasis.
Figures
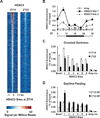
Figure 1. Circadian rhythm of genomic HDAC3 recruitment in mouse liver
A. Heatmap of HDAC3 binding signal at ZT10 (left) and ZT22 (right) from −1kb to +1kb surrounding the center of all the HDAC3 ZT10 binding sites, ordered by strength of HDAC3 binding at ZT10. ChIP-Seq with anti-HDAC3 antibody was performed and data were analyzed as described in Methods. Each line represents a single HDAC3 binding site and the color scale indicates the HDAC3 signal (reads encompassing each locus per million total reads). A read is a unique sequence obtained in ChIP-Seq and then aligned to the mouse genome. ZT, Zeitgeber time (light-on at ZT0, off at ZT12). B. HDAC3 recruitment at 2 selected genomic sites over a 24h cycle by ChIP-PCR. Immunoprecipitated DNA was normalized to input. Values are mean ± s.e.m. (n=4–5). C. HDAC3 diurnal genomic recruitment is maintained in constant darkness. Six HDAC3 binding sites were assessed by ChIP-PCR (n=4–5), and the Bmal1 promoter served as a positive control (23); regions close to the TSS of the Arbp and Ins genes served as negative controls. CT, Circadian time. D. The rhythm of HDAC3 recruitment is reversed by day-time feeding (n=4–5). RF, food was provided only from ZT3 to ZT11 every day for 2 weeks.
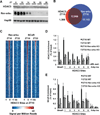
Figure 2. Orchestration of genome-wide rhythms of histone acetylation, Pol II recruitment, and gene expression by HDAC3
A. Heatmap of the histone H3 lysine 9 acetylation (H3K9Ac) signal in WT liver at ZT22 (left), ZT10 (middle) and ZT10 in liver depleted of HDAC3 (KO) (right) from −1kb to +1kb surrounding the center of all the HDAC3 ZT10 binding sites, ordered by k means clustering of H3K9Ac signal. Each line represents a single HDAC3 binding site and the color scale indicates the H3K9Ac signal per million total reads. HDAC3 depleted liver was removed from HDAC3fl/fl mice 1 week after injection of AAV-Cre as in Methods. B. Average H3K9Ac signal from −1kb to +1kb surrounding the center of all the HDAC3 ZT10 binding sites. The Y axis represents the HDAC3 signal per million total reads. C. Heatmap of Pol II signal at ZT10 (left), and ZT22 (right) from −1kb to +1kb surrounding the TSS of genes with HDAC3 recruitment within 10 kb of the TSS, ordered by strength of Pol II binding at ZT22. Each line represents a single HDAC3 bound gene and the color scale indicates the Pol II signal per million total reads. Green marks denote 130 genes under the Gene Ontology term “Lipid Biosynthetic Process”, listed in Supp. Table 1. D. Genes up-regulated in liver depleted of HDAC3 are significantly enriched for HDAC3 binding at ZT10. Expression arrays of WT and HDAC3 KO liver were performed and analyzed as described in Methods, and the percentage of HDAC3 bound genes in each category was calculated. *p~10−156 based on hypergeometic distribution as in Methods.
Figure 3. Recruitment of HDAC3 to the genome by Rev-erbα
A. Immunoblot of HDAC3 and Rev-erbα over a 24h cycle in mouse liver. Hsp90 protein levels are shown as loading control. B. The HDAC3 cistrome at ZT10 largely overlaps with the Rev-erbα cistrome at ZT10. ChIP-Seq with anti-Rev-erbα antibody was performed and analyzed as described in Methods. C. Heatmap of Rev-erbα at ZT10 and ZT22 (left) and of NCoR at ZT10 and ZT22 (right), both at HDAC3 ZT10 sites ordered as in Fig. 1A. Each line represents a single HDAC3 binding site and the color scale indicates the signal per million total reads. D, E. HDAC3 (D) and NCoR (E) recruitment to six binding sites (as in Fig. 1C) were interrogated by ChIP-PCR in liver from mice lacking Rev-erbα. The Bmal1 promoter was used as a positive control (23); regions close to the TSS of the Arbp and Ins genes served as negative controls. Values are mean ± s.e.m. (n=3).
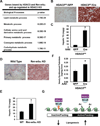
Figure 4. Regulation of hepatic lipid homeostasis by HDAC3
A. Gene Ontology analysis of the HDAC3 and Rev-erbα-bound genes that were upregulated in liver depleted of HDAC3 was performed as described in Methods. B. Oil Red O staining of liver from 12 week old HDAC3fl/fl mice 2 weeks after tail vein injection of AAV-GFP or AAV-Cre. C. Hepatic triglyceride (TG) levels in mice treated as in “B”. D. Oil Red O staining of livers from 9 week old WT and mice lacking Rev-erbα (Rev-erbα KO). E. Hepatic TG levels in from livers from 9 week old WT and mice lacking Rev-erbα (Rev-erbα KO). Values are mean ± s.e.m. (n=4). *p<0.05 by student’s t-test. F. Hepatic de novo lipogenesis (DNL) in 12 week old HDAC3fl/fl mice 1 week after infection with AAV-Cre or with AAV-GFP. Hepatic DNL is measured as newly synthesized 2H labeled palmitate. Values are mean ± s.e.m. (n=7–8). *p<0.05 by student’s t-test. G. Model depicting the mechanistic links between the daily cycles of Rev-erbα expression, HDAC3 genomic recruitment, epigenomic status, and hepatic lipogenesis.
Comment in
- Physiology. Crise de foie, redux?
Moore DD. Moore DD. Science. 2011 Mar 11;331(6022):1275-6. doi: 10.1126/science.1203194. Science. 2011. PMID: 21393533 No abstract available. - Circadian rhythms: I'm not fat, I just need more sleep.
Huddleston JE. Huddleston JE. Nat Rev Mol Cell Biol. 2011 May;12(5):282. doi: 10.1038/nrm3106. Epub 2011 Apr 13. Nat Rev Mol Cell Biol. 2011. PMID: 21487435 No abstract available. - Circadian control of epigenetic modifications modulates metabolism.
Duez H, Staels B. Duez H, et al. Circ Res. 2011 Aug 5;109(4):353-5. doi: 10.1161/RES.0b013e31822be420. Circ Res. 2011. PMID: 21817162 Free PMC article. - Does it matter not only how much but also when we eat to induce fatty liver?
Hellerbrand C, Weiskirchen R. Hellerbrand C, et al. Hepatology. 2011 Sep 2;54(3):1096-9. doi: 10.1002/hep.24522. Hepatology. 2011. PMID: 22179989 No abstract available.
Similar articles
- Physiology. Crise de foie, redux?
Moore DD. Moore DD. Science. 2011 Mar 11;331(6022):1275-6. doi: 10.1126/science.1203194. Science. 2011. PMID: 21393533 No abstract available. - Circadian epigenomic remodeling and hepatic lipogenesis: lessons from HDAC3.
Sun Z, Feng D, Everett LJ, Bugge A, Lazar MA. Sun Z, et al. Cold Spring Harb Symp Quant Biol. 2011;76:49-55. doi: 10.1101/sqb.2011.76.011494. Epub 2011 Sep 6. Cold Spring Harb Symp Quant Biol. 2011. PMID: 21900149 Free PMC article. Review. - Dissecting the Rev-erbα Cistrome and the Mechanisms Controlling Circadian Transcription in Liver.
Fang B, Lazar MA. Fang B, et al. Cold Spring Harb Symp Quant Biol. 2015;80:233-8. doi: 10.1101/sqb.2015.80.027508. Epub 2015 Sep 14. Cold Spring Harb Symp Quant Biol. 2015. PMID: 26370410 Review. - The orphan nuclear receptor Rev-erbalpha recruits the N-CoR/histone deacetylase 3 corepressor to regulate the circadian Bmal1 gene.
Yin L, Lazar MA. Yin L, et al. Mol Endocrinol. 2005 Jun;19(6):1452-9. doi: 10.1210/me.2005-0057. Epub 2005 Mar 10. Mol Endocrinol. 2005. PMID: 15761026 - GENE REGULATION. Discrete functions of nuclear receptor Rev-erbα couple metabolism to the clock.
Zhang Y, Fang B, Emmett MJ, Damle M, Sun Z, Feng D, Armour SM, Remsberg JR, Jager J, Soccio RE, Steger DJ, Lazar MA. Zhang Y, et al. Science. 2015 Jun 26;348(6242):1488-92. doi: 10.1126/science.aab3021. Epub 2015 Jun 4. Science. 2015. PMID: 26044300 Free PMC article.
Cited by
- Functional Characterization of Circadian Nuclear Receptors REV-ERBα and REV-ERBβ in Human Osteosarcoma Cell Cultures.
Cho H, Yun A, Kim J, Park E, Jung JW, Chung S, Son GH. Cho H, et al. Int J Mol Sci. 2024 Jan 7;25(2):770. doi: 10.3390/ijms25020770. Int J Mol Sci. 2024. PMID: 38255844 Free PMC article. - Circadian Influence on Metabolism and Inflammation in Atherosclerosis.
McAlpine CS, Swirski FK. McAlpine CS, et al. Circ Res. 2016 Jun 24;119(1):131-41. doi: 10.1161/CIRCRESAHA.116.308034. Circ Res. 2016. PMID: 27340272 Free PMC article. Review. - Long-Range Chromosome Interactions Mediated by Cohesin Shape Circadian Gene Expression.
Xu Y, Guo W, Li P, Zhang Y, Zhao M, Fan Z, Zhao Z, Yan J. Xu Y, et al. PLoS Genet. 2016 May 2;12(5):e1005992. doi: 10.1371/journal.pgen.1005992. eCollection 2016 May. PLoS Genet. 2016. PMID: 27135601 Free PMC article. - Small Heterodimer Partner (NR0B2) Coordinates Nutrient Signaling and the Circadian Clock in Mice.
Wu N, Kim KH, Zhou Y, Lee JM, Kettner NM, Mamrosh JL, Choi S, Fu L, Moore DD. Wu N, et al. Mol Endocrinol. 2016 Sep;30(9):988-95. doi: 10.1210/me.2015-1295. Epub 2016 Jul 18. Mol Endocrinol. 2016. PMID: 27427832 Free PMC article. - Insulin/Snail1 axis ameliorates fatty liver disease by epigenetically suppressing lipogenesis.
Liu Y, Jiang L, Sun C, Ireland N, Shah YM, Liu Y, Rui L. Liu Y, et al. Nat Commun. 2018 Jul 16;9(1):2751. doi: 10.1038/s41467-018-05309-y. Nat Commun. 2018. PMID: 30013137 Free PMC article.
References
- Pietroiusti A, et al. Occup Environ Med. 2010 Jan;67:54. - PubMed
- De Bacquer D, et al. Int J Epidemiol. 2009 Jun;38:848. - PubMed
Publication types
MeSH terms
Substances
Grants and funding
- R01 DK045586/DK/NIDDK NIH HHS/United States
- RC1 DK086239/DK/NIDDK NIH HHS/United States
- DK43806/DK/NIDDK NIH HHS/United States
- P01 DK049210/DK/NIDDK NIH HHS/United States
- HG4069/HG/NHGRI NIH HHS/United States
- DK45586/DK/NIDDK NIH HHS/United States
- R01 DK043806/DK/NIDDK NIH HHS/United States
- DK49210/DK/NIDDK NIH HHS/United States
- RC1DK08623/DK/NIDDK NIH HHS/United States
- DK19525/DK/NIDDK NIH HHS/United States
- R01 HG004069/HG/NHGRI NIH HHS/United States
- R37 DK043806/DK/NIDDK NIH HHS/United States
- P30 DK019525/DK/NIDDK NIH HHS/United States
LinkOut - more resources
Full Text Sources
Other Literature Sources
Molecular Biology Databases


