Identification of a therapeutic strategy targeting amplified FGF19 in liver cancer by Oncogenomic screening - PubMed (original) (raw)
. 2011 Mar 8;19(3):347-58.
doi: 10.1016/j.ccr.2011.01.040.
Maia Chanrion, Chunlin Cai, Guanming Wu, Jianping Zhang, Lars Zender, Alice Zhao, Ronald W Busuttil, Herman Yee, Lincoln Stein, Dorothy M French, Richard S Finn, Scott W Lowe, Scott Powers
Affiliations
- PMID: 21397858
- PMCID: PMC3061399
- DOI: 10.1016/j.ccr.2011.01.040
Identification of a therapeutic strategy targeting amplified FGF19 in liver cancer by Oncogenomic screening
Eric T Sawey et al. Cancer Cell. 2011.
Abstract
We screened 124 genes that are amplified in human hepatocellular carcinoma (HCC) using a mouse hepatoblast model and identified 18 tumor-promoting genes, including CCND1 and its neighbor on 11q13.3, FGF19. Although it is widely assumed that CCND1 is the main driving oncogene of this common amplicon (15% frequency in HCC), both forward-transformation assays and RNAi-mediated inhibition in human HCC cells established that FGF19 is an equally important driver gene in HCC. Furthermore, clonal growth and tumorigenicity of HCC cells harboring the 11q13.3 amplicon were selectively inhibited by RNAi-mediated knockdown of CCND1 or FGF19, as well as by an anti-FGF19 antibody. These results show that 11q13.3 amplification could be an effective biomarker for patients most likely to respond to anti-FGF19 therapy.
Copyright © 2011 Elsevier Inc. All rights reserved.
Figures
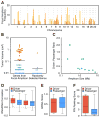
Figure 1. Recurrent focal amplicons in HCC are enriched for tumor-promoting driver genes
(A) Genome-wide frequency plot of focal amplicons (< 10 Mb) identified by ROMA aCGH in 89 primary HCCs and 12 HCC cell lines. (B) Comparison of the tumorigenicity induced by genes (cDNAs) picked from focal amplicons to randomly selected genes. p53−/−;Myc hepatoblasts transfected with cDNA expression constructs were injected subcutaneously and after 42 days the resultant tumors were measured. Genes were scored as positive (red) if at least half the tumors measured greater than 0.1 cm3. Confirmation of tumorigenicity was performed as described in Supplemental Experimental Procedures. (C) The ratio of functionally-validated drivers to passengers is displayed relative to the size of the amplicon in which the tested genes were located. Amplicon size was inversely correlated with the proportion of driver genes (r = −0.70, p = 0.006). (D) Correlation coefficients of RNA levels to DNA copy number in two independent datasets are shown for both the driver and passenger genes. The two left-most columns are from the dataset reported here and although the mean correlation was higher in the oncogenic set, it failed to pass the significance level of p < 0.05. The two right-most columns are from the dataset of (Chiang et al. 2008). (E) GRAIL scores of both the driver and passenger genes. The passenger genes have a very slightly lower mean GRAIL score but this difference is not significant. (F) Functional Interaction Network (FIN) – based ranking scores of both the driver and passenger genes. The driver genes have a significantly higher mean value (p < 0.018). See also Figure S2.
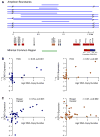
Figure 2. Epicenter mapping and expression of genes in the 11q13.3 amplicon in HCC and the difference in the effect of amplification on FGF19 and CCND1 expression between breast and liver tumors
(A) Individual boundaries and the region of common overlap for the 14 11q13.3 amplicons, along with the underlying RefSeq genes in the depicted 1.5 Mb region, are displayed. The genes are color-coded (see inserted scale) to indicate the degree of correlation between DNA copy number and gene expression. Correlation coefficients between DNA copy number and expression are for FGF3 (r= −0.20, p=0.36) and FGF4 (r= 0.17, p=0.45), statistically insignificant in HCC. (B) Scatter plots with associated correlation coefficients showing the relationship in HCC samples (both tumors and cell lines) between DNA copy number and expression for CCND1 (left) and FGF19 (right). (C) As in (B) but with breast cancer cell line samples. See also Figure S3.
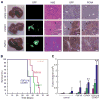
Figure 3. FGF19 and CCND1 cooperate to promote liver carcinoma formation
(A) Images of mouse livers and liver sections taken eight weeks following transplantation of p53−/−;Myc hepatoblasts expressing either empty vector, CCND1, or FGF19. The five panel columns are, from left to right, intact livers; fluorescent imaging of intact liver for GFP-positive transplanted cells; hematoxylin and eosin staining of liver tissue sections showing the border between normal liver and carcinoma (arrows); immunohistochemical detection of GFP; and immunohistochemical detection of PCNA. The last three are from the same tissue block. Size bars = 100μm. (B) Kaplan-Meier plot showing the percentage of mouse survival at various times post-transplantation. The livers of mice were transplanted with p53−/−;Myc hepatoblasts infected with either control vectors, FGF19 alone, CCND1 alone, or both genes in combination. (C) Subcutaneous growth of p53−/−;Myc hepatoblasts infected with either control vector pMSCVpuro, control vector pMSCVhygro, FGF19 alone, CCND1 alone, or FGF19 with CCND1 (n=10 injections, asterisks indicate that the indicated tumor group is significantly different than controls, error bars denote ± SD, *p<0.05, **p<0.0005). Tumor volumes were determined on 28 (red columns), 35 (green columns), and 42 (blue columns) days after injection. See also Figure S4.
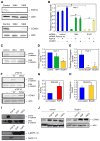
Figure 4. FGF19 and CCND1 functionally interact through β-catenin signaling
(A) FGF19 and cyclin D1 protein expression in Huh-7 (11q13.3-amplified) cells following stable transfection with one shRNA targeting luciferase (control) and two independent shRNAs targeting FGF19 (19K4 and 19K5). (B) Quantification of clonogenicity of Huh-7 cells infected with shRNAs against FGF19 (19K4) and CCND1 (D1K2) are shown relative to results obtained with a shRNA against luciferase (control). Recombinant FGF19 protein was added to the medium, or a shRNA-insensitive CCND1 expression construct was transfected into the cells, where indicated (error bars denote ± SD, *p<0.005). (C) Active β-catenin levels in Huh-7 cells expressing the two shRNAs targeting FGF19, as revealed by immunoblotting with an antibody specific for the activated form of β-catenin, relative to total β–catenin levels. (D) TCF reporter activity, relative to constitutively-expressing renilla luciferase activity, in Huh-7 cells infected with shRNAs against FGF19 (19K4) or β-catenin (BcatK1), compared to a shRNA against luciferase (control) (error bars denote ± SD, *p<0.05). (E) Quantification of clonogenicity of Huh-7 cells infected with shRNAs against CTNNB1 (BcatK1 and BcatK4) are shown relative to a non-targeting shRNA (control) (error bars denote ± SD, *p<0.05). (F) Time-course effects of adding FGF19 to the medium of SNU423 cells (with a single copy of 11q13.3) on active β-catenin levels, as well as the effects of added FGF19 on cyclin D1 protein levels, as detected by immunoblotting. (G) TCF reporter activity, relative to constitutively-expressing renilla luciferase activity, in SNU423 cells treated for 24 hours with recombinant FGF19, compared to non-treated cells (error bars denote ± SD, *p<0.05). (H) Quantification of clonogenicity in SNU423 cells infected with an effective shRNA against CTNNB1 (BcatK1), compared to cells infected with a non-targeting shRNA (error bars denote ± SD, p=0.169). (I) SNU423 cells were treated with FGF19, EGF or FGF2. β–catenin and MAPK activity were determined by immunoblotting after 15 minutes, while cyclin D1 protein was detected after 24 hours exposure. (J) SNU423 cells infected with either a non-targeting shRNA (control) or an effective shRNA targeting β–catenin (BcatK1) were treated with FGF19, EGF or FGF2 for 24 hours and then cyclin D1 protein levels were detected by immunoblotting. See also Figure S5.
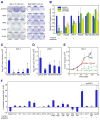
Figure 5. CCND1 and FGF19 oncogene dependency in human HCC cell lines
(A) Clonogenicity assay of Huh-7 cells (11q13.3-amplified) and SNU182 cells (single-copy for 11q13.3) infected with shRNAs against luciferase (control), FGF19 (19K4 and 19K5), and CCND1 (D1K2 and D1K4). (B) Quantification of clonogenicity in six cell lines (three with 11q13.3 amplification and three without) infected with shRNAs against FGF19 (19K4 and 19K5) and CCND1 (D1K2 and D1K4) relative to a shRNA against luciferase (control). For each of the six cell lines, the results are displayed in this order (from left to right): cells infected with control shRNA (blue column), 19K4 and 19K5 shRNAs (green columns), and D1K2 and D1K4 shRNAs (yellow columns) (error bars denote ± SD, *p<0.001). (C) Subcutaneous tumor growth in nude mice of Huh-7 cells infected with indicated shRNAs (n=12 injections, error bars denote ± SD, *p<0.005). (D) As in (C) but with JHH-7 cells (n=10 injections, error bars denote ± SD, *p<0.01, **p<0.0001). (E) Subcutaneous growth of established tumors from Huh-7 cells treated either with PBS, control antibody, or anti-FGF19 antibody (1A6). Treatment was on the days marked with red asterisks. Dashed lines indicate that mice were terminated before the end of the study (n=20 injections, error bars denote ± SEM, **p<0.05). (F) Growth inhibition of HCC cell lines grown in vitro with anti-FGF19 antibody (1A6) relative to the indicated 11q13.3 amplification status. Error bars denote ± SEM. The bracket above the four amplified cell lines indicates that by Student s t-test the average growth inhibition by the anti-FGF19 antibody was significantly greater than that of the non-amplified control group. See also Figure S6.
Similar articles
- FGF401 and vinorelbine synergistically mediate antitumor activity and vascular normalization in FGF19-dependent hepatocellular carcinoma.
Huynh H, Prawira A, Le TBU, Vu TC, Hao HX, Huang A, Wang Y, Porta DG. Huynh H, et al. Exp Mol Med. 2020 Nov;52(11):1857-1868. doi: 10.1038/s12276-020-00524-4. Epub 2020 Nov 25. Exp Mol Med. 2020. PMID: 33235319 Free PMC article. - ST6GAL1 Is a Novel Serum Biomarker for Lenvatinib-Susceptible FGF19-Driven Hepatocellular Carcinoma.
Myojin Y, Kodama T, Maesaka K, Motooka D, Sato Y, Tanaka S, Abe Y, Ohkawa K, Mita E, Hayashi Y, Hikita H, Sakamori R, Tatsumi T, Taguchi A, Eguchi H, Takehara T. Myojin Y, et al. Clin Cancer Res. 2021 Feb 15;27(4):1150-1161. doi: 10.1158/1078-0432.CCR-20-3382. Epub 2020 Dec 7. Clin Cancer Res. 2021. PMID: 33288659 - Regulation of amphiregulin gene expression by β-catenin signaling in human hepatocellular carcinoma cells: a novel crosstalk between FGF19 and the EGFR system.
Latasa MU, Salis F, Urtasun R, Garcia-Irigoyen O, Elizalde M, Uriarte I, Santamaria M, Feo F, Pascale RM, Prieto J, Berasain C, Avila MA. Latasa MU, et al. PLoS One. 2012;7(12):e52711. doi: 10.1371/journal.pone.0052711. Epub 2012 Dec 20. PLoS One. 2012. PMID: 23285165 Free PMC article. - H3B-6527 Is a Potent and Selective Inhibitor of FGFR4 in FGF19-Driven Hepatocellular Carcinoma.
Joshi JJ, Coffey H, Corcoran E, Tsai J, Huang CL, Ichikawa K, Prajapati S, Hao MH, Bailey S, Wu J, Rimkunas V, Karr C, Subramanian V, Kumar P, MacKenzie C, Hurley R, Satoh T, Yu K, Park E, Rioux N, Kim A, Lai WG, Yu L, Zhu P, Buonamici S, Larsen N, Fekkes P, Wang J, Warmuth M, Reynolds DJ, Smith PG, Selvaraj A. Joshi JJ, et al. Cancer Res. 2017 Dec 15;77(24):6999-7013. doi: 10.1158/0008-5472.CAN-17-1865. Cancer Res. 2017. PMID: 29247039 - Novel Abs targeting the N-terminus of fibroblast growth factor 19 inhibit hepatocellular carcinoma growth without bile-acid-related side-effects.
Liu H, Zheng S, Hou X, Liu X, Du K, Lv X, Li Y, Yang F, Li W, Sui J. Liu H, et al. Cancer Sci. 2020 May;111(5):1750-1760. doi: 10.1111/cas.14353. Epub 2020 Mar 20. Cancer Sci. 2020. PMID: 32061104 Free PMC article.
Cited by
- NUPR1, a new target in liver cancer: implication in controlling cell growth, migration, invasion and sorafenib resistance.
Emma MR, Iovanna JL, Bachvarov D, Puleio R, Loria GR, Augello G, Candido S, Libra M, Gulino A, Cancila V, McCubrey JA, Montalto G, Cervello M. Emma MR, et al. Cell Death Dis. 2016 Jun 23;7(6):e2269. doi: 10.1038/cddis.2016.175. Cell Death Dis. 2016. PMID: 27336713 Free PMC article. - Prevention of hepatocellular carcinoma: potential targets, experimental models, and clinical challenges.
Hoshida Y, Fuchs BC, Tanabe KK. Hoshida Y, et al. Curr Cancer Drug Targets. 2012 Nov 1;12(9):1129-59. Curr Cancer Drug Targets. 2012. PMID: 22873223 Free PMC article. Review. - Isoform-specific inhibition of FGFR signaling achieved by a de-novo-designed mini-protein.
Park JS, Choi J, Cao L, Mohanty J, Suzuki Y, Park A, Baker D, Schlessinger J, Lee S. Park JS, et al. Cell Rep. 2022 Oct 25;41(4):111545. doi: 10.1016/j.celrep.2022.111545. Cell Rep. 2022. PMID: 36288716 Free PMC article. - FGF19 functions as autocrine growth factor for hepatoblastoma.
Elzi DJ, Song M, Blackman B, Weintraub ST, López-Terrada D, Chen Y, Tomlinson GE, Shiio Y. Elzi DJ, et al. Genes Cancer. 2016 Mar;7(3-4):125-35. doi: 10.18632/genesandcancer.101. Genes Cancer. 2016. PMID: 27382436 Free PMC article. - Endocrine fibroblast growth factors 15/19 and 21: from feast to famine.
Potthoff MJ, Kliewer SA, Mangelsdorf DJ. Potthoff MJ, et al. Genes Dev. 2012 Feb 15;26(4):312-24. doi: 10.1101/gad.184788.111. Epub 2012 Feb 2. Genes Dev. 2012. PMID: 22302876 Free PMC article. Review.
References
- Albertson DG, Collins C, McCormick F, Gray JW. Chromosome aberrations in solid tumors. Nat Genet. 2003;34:369–376. - PubMed
- Azechi H, Nishida N, Fukuda Y, Nishimura T, Minata M, Katsuma H, Kuno M, Ito T, Komeda T, Kita R, et al. Disruption of the p16/cyclin D1/retinoblastoma protein pathway in the majority of human hepatocellular carcinomas. Oncology. 2001;60:346–354. - PubMed
- Briata P, Ilengo C, Corte G, Moroni C, Rosenfeld MG, Chen CY, Gherzi R. The Wnt/beta-catenin-->Pitx2 pathway controls the turnover of Pitx2 and other unstable mRNAs. Mol Cell. 2003;12:1201–1211. - PubMed
Publication types
MeSH terms
Substances
Grants and funding
- RC2 CA148532-01/CA/NCI NIH HHS/United States
- R01 CA124648-04/CA/NCI NIH HHS/United States
- CA076905/CA/NCI NIH HHS/United States
- RC2 CA148532/CA/NCI NIH HHS/United States
- CA148532/CA/NCI NIH HHS/United States
- P30 CA008748/CA/NCI NIH HHS/United States
- RC2 CA148532-02/CA/NCI NIH HHS/United States
- R01 CA124648-05/CA/NCI NIH HHS/United States
- U01 CA105388/CA/NCI NIH HHS/United States
- P01 CA013106/CA/NCI NIH HHS/United States
- R01 CA124648-03/CA/NCI NIH HHS/United States
- CA105388/CA/NCI NIH HHS/United States
- R01 CA124648-02/CA/NCI NIH HHS/United States
- R01 CA124648-01/CA/NCI NIH HHS/United States
- R01 CA124648/CA/NCI NIH HHS/United States
- CA124648/CA/NCI NIH HHS/United States
- K12 CA076905/CA/NCI NIH HHS/United States
LinkOut - more resources
Full Text Sources
Other Literature Sources
Medical
Molecular Biology Databases
Research Materials
