Brain infiltration of leukocytes contributes to the pathophysiology of temporal lobe epilepsy - PubMed (original) (raw)
Brain infiltration of leukocytes contributes to the pathophysiology of temporal lobe epilepsy
Michela Zattoni et al. J Neurosci. 2011.
Abstract
Clinical and experimental evidence indicates that inflammatory processes contribute to the pathophysiology of epilepsy, but underlying mechanisms remain mostly unknown. Using immunohistochemistry for CD45 (common leukocyte antigen) and CD3 (T-lymphocytes), we show here microglial activation and infiltration of leukocytes in sclerotic tissue from patients with mesial temporal lobe epilepsy (TLE), as well as in a model of TLE (intrahippocampal kainic acid injection), characterized by spontaneous, nonconvulsive focal seizures. Using specific markers of lymphocytes, microglia, macrophages, and neutrophils in kainate-treated mice, we investigated with pharmacological and genetic approaches the contribution of innate and adaptive immunity to kainate-induced inflammation and neurodegeneration. Furthermore, we used EEG analysis in mutant mice lacking specific subsets of lymphocytes to explore the significance of inflammatory processes for epileptogenesis. Blood-brain barrier disruption and neurodegeneration in the kainate-lesioned hippocampus were accompanied by sustained ICAM-1 upregulation, microglial cell activation, and infiltration of CD3(+) T-cells. Moreover, macrophage infiltration was observed, selectively in the dentate gyrus where prominent granule cell dispersion was evident. Unexpectedly, depletion of peripheral macrophages by systemic clodronate liposome administration affected granule cell survival. Neurodegeneration was aggravated in kainate-lesioned mice lacking T- and B-cells (RAG1-knock-out), because of delayed invasion by Gr-1(+) neutrophils. Most strikingly, these mutant mice exhibited early onset of spontaneous recurrent seizures, suggesting a strong impact of immune-mediated responses on network excitability. Together, the concerted action of adaptive and innate immunity triggered locally by intrahippocampal kainate injection contributes seizure-suppressant and neuroprotective effects, shedding new light on neuroimmune interactions in temporal lobe epilepsy.
Figures
Figure 1.
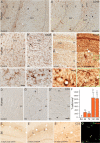
Leukocyte infiltration in human (A, C) and C57BL/6J (B6) mouse (B, D, E, F) epileptic tissue. A, A′, Low-magnification view of CD45 immunoreactivity in hippocampal tissue from a postmortem control (A) and resected from a patient with intractable MTLE (A′) depicting the presence of resting and activated microglial cells, respectively, and of blood vessel-associated and intraparenchymal leukocytes (A′, arrowheads). The marked sclerosis of the epileptic tissue is denoted by the shrinking of the CA1 area. B, B′, CD45 immunoreactivity in control and sclerotic CA1 area, with arrowheads pointing to leukocytes; the boxed areas are enlarged at the bottom. C, C′, For comparison, CD45 immunoreactivity in a mouse with a unilateral intrahippocampal KA injection; the contralateral side (C) is depicted as control. Ipsilaterally (C′), a mixture of activated microglial cells, leukocytes (arrowheads), and large macrophage-like cells (arrows) are evident. The green and red boxed areas are enlarged at the bottom. D–D″, Detection of intraparenchymal CD3+ lymphocytes (arrowheads) in sclerotic tissue from CA1 (D′) and hilus (D″) in MTLE patients, but not postmortem control (D). E–E″, Selective infiltration by CD3+ lymphocytes in mouse epileptic tissue; in control (saline) (E), no CD3 immunoreactivity was seen. In KA-treated tissue, CD3+ cells were seen first in blood vessels (E′) (2 d time point) and later intraparenchymally (E″) (14 d time point). F, Unbiased quantification of CD3+ lymphocytes in the KA-lesioned dorsal hippocampal formation, demonstrating their absence in control mice (Sal) and a significant biphasic increase after KA injection (mean ± SEM; #p < 0.05 compared with 7 d; **p < 0.01 compared with Sal; n = 6 per group; Bonferroni's posttest analysis). G, Example of double immunofluorescence staining for CD3 (green) and CD8 (red) depicting a subset of double-labeled cells in the CA1 region (arrowheads). Abbreviations: GCL, Granule cell layer; HL, hilus; HS, hippocampal sclerosis; ML, molecular layer; SLM, stratum lacunosum-moleculare; SP, stratum pyramidale; SR, stratum radiatum. Scale bars: A, 500 μm; B, C, 20 μm; D, E, 50 μm; G, 20 μm.
Figure 2.
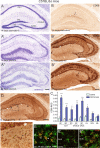
Activation of innate immunity in KA-lesioned hippocampal formation of B6 mice. A–A″, Gradual degeneration of CA1, CA3c, and hilar neurons, along with dentate gyrus granule cell dispersion, as seen in KA-injected hippocampus by cresyl violet staining compared with control (saline). B–B″, CD68 immunoreactivity in sections from the same mice, depicting the regular distribution of resting microglia in control (B), with a slight increase in staining around the saline injection site (arrow), and the strong increase in all regions where neurodegeneration was evident in KA-treated tissue (B′, B″). Note that microglia activation does not occur in the dentate gyrus, except for a few isolated cells at late time points (B″, arrow). C, Densitometric analysis of CD68 immunoreactivity, showing selective increase in areas of neuronal cell loss compared with saline control. The increase was significant in the pyramidal layer of CA1, CA3a,b, and CA3c, in the stratum radiatum and oriens of CA1 and in the hilus. The relative optical density (ROD) are given as mean ± SEM (*p < 0.05, **p < 0.01, ***p < 0.001, Bonferroni's posttest; n = 11). D, Detection of activated microglia (arrow) and macrophage-like cells (arrowheads) by F4/80 immunostaining in KA-injected hippocampus. The boxed area is enlarged below the panel. E–E″, Double-immunofluorescence staining for Iba1 (green) and F4/80 (red) showing the distinctive morphology of microglial cells and macrophage-like cells in the molecular layer 14 d after KA injection; for comparison, the contralateral and ipsilateral stratum-lacunosum-moleculare is also depicted. CA, Cornu ammonis; DG, dentate gyrus; GCL, granule cell layer; ML, molecular layer; SLM, stratum lacunosum-moleculare; SO, stratum oriens; SP, stratum pyramidale; SR, stratum radiatum; HL, hilus. Scale bars: A, B, D, 250 μm; E, 20 μm.
Figure 3.
Enhanced KA-induced neurodegeneration in RAG1-KO mice. A–A″, The general pattern of neurodegeneration induced by KA was globally similar to wild type, but was most severe and led to complete destruction by 28 d after KA, as seen by cresyl violet staining. B–B″, CD68 immunoreactivity again mirrored precisely the neurodegeneration. In control (B), a slight enhancement was seen at the injection site (arrow). C, Densitometric analysis of CD68 immunoreactivity, with ROD being normalized to wild type (indicated by a dashed line; two-way ANOVA, Bonferroni's posttest; *p < 0.05, **p < 0.01, ***p < 0.001). Error bars indicate SEM. D–D″, Example of a mouse with severe degeneration seen at 14 d after KA by Nissl staining (D) and CD68 immunoreactivity (D′); in such case, staining for Gr-1 (D″) revealed the presence of numerous Gr-1-positive neutrophils (arrowheads) in zones of extensive degeneration. For abbreviations, see Figure 2. Scale bars: All panels, 250 μm.
Figure 4.
Engulfment of Gr-1+ neutrophils by activated microglial cells in RAG1-KO mice, as visualized by double immunofluorescence for Gr-1 (red) and Iba1 (green). Nuclei were counterstained with Sytox Green (blue). Images were acquired by confocal laser-scanning microscopy and depicted as maximal intensity projection of 10–15 layers spaced by 0.5 μm. A, Representative image from a B6 mouse, stratum radiatum of CA1, 14 d after KA injection, depicting the bushy appearance of activated microglial cells. The weak Gr-1 staining observed in B6 animals was not detected here because of the laser setting used for these images. B, C, Images from a RAG1-KO mice 14 d after KA injection. Gr-1+ cells (red) were identified as neutrophils based on their lobulated nucleus, as shown in color-separated images (B′, C′); the asterisk (*) in B and B′ indicates a transversally cut capillary; note that most nuclei belong to microglial cells, emphasizing their predominance in the lesioned tissue. Gr-1+ neutrophils were surrounded by one or several activated microglial cells, often strongly labeled for Iba1 (B, arrows), or even engulfed by them (B, arrowheads). These features are illustrated at higher magnification in C and C′, depicting two microglial cells establishing direct contacts with a Gr-1+ neutrophil, covering most of its surface. Scale bars: A, B, 20 μm; C, 10 μm.
Figure 5.
Depletion of Gr-1+ neutrophils by systemic anti-Gr-1 treatment prevents exacerbated neurodegeneration in RAG1-KO mice. A, A′, Representative example of a control RAG1-KO mouse, administered with control IgGs. A depicts infiltrating Gr1+ neutrophils into the KA-lesioned hippocampus and A′ depicts the corresponding CD68 staining. B, B′, Example of a RAG1-KO mouse treated with anti-Gr-1 antibodies. Nissl staining (B) and CD68 immunoreactivity (B′) illustrate a lesion similar to those seen in B6 mice (Fig. 2). C, Densitometric analysis of CD68 staining at 10 d after KA in RAG1-KO mice treated with anti-Gr-1 antibodies compared with control, untreated mice (dashed line). D, Densitometric analysis of CD68 staining in KA-injected RAG1-KO mice treated with anti-Gr-1 antibodies compared with KA-injected B6 mice (dashed lines). In both cases, no single region of interest had significantly different intensity of CD68 immunoreactivity in the two groups. Error bars indicate SEM. Scale bar, 250 μm.
Figure 6.
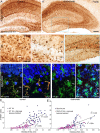
Depletion of peripheral mononuclear phagocytes affects dispersion and survival of dentate gyrus granule cells. A, A′, Effect of clodronate liposome treatment on the distribution of F4/80+ macrophage like-cells in the dentate gyrus of representative RAG1-KO mice. The red and blue boxed areas are enlarged below the main panels. B, For comparison, F4/80+ macrophages seen in B6 mice are depicted. C, D, Images of triple-immunofluorescence staining in the dentate gyrus against Iba1 (green), F4/80 (red), and NeuN (blue) of KA-treated RAG1-KO mice. Images were acquired by confocal laser-scanning microscopy and depicted as maximal intensity projection of 10–15 layers spaced by 0.5 μm. C, C′, In control mice, 10 d after KA, Iba1+ resting microglial cells were recognized contralaterally, by their long and slender processes and faint F4/80-IR (C; arrow). “Alerted” microglial cells were seen ipsilaterally (arrow), along with strongly labeled F4/80+ macrophage-like cells characterized by their larger cell body and short and thick processes (C′). Note the preservation of granule cells, which were enlarged and dispersed. D, D′, Representative images from RAG1-KO KA-injected mice treated with clodronate liposomes. Strongly labeled F4/80+ macrophages were conspicuously absent; microglial cells were alerted in zones where the granule cell layer was intact (D), whereas numerous activated microglial cells, with a “bushy” appearance, were seen where granule cell degeneration was evident (D′, arrow). E, E′, Correlation between granule cell dispersion and density of F4/80+ macrophages in B6 (E) and RAG1-KO (E′) mice. Each scatter plot depicts data from KA-injected mice treated with clodronate liposomes and untreated control mice. Regression analysis (thickness of granule cell layer versus number of F4/80+ cells) revealed in each genotype a significant correlation in both groups of mice. In addition, effect of clodronate liposome treatment was reflected by significantly reduced thickness of the granule cell layer and significantly reduced number of F4/80+ macrophages, occurring in both genotypes. Scale bars: A, 250 μm; B, 50 μm; C, D, 20 μm.
Figure 7.
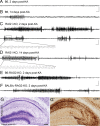
Representative hippocampal EEG recordings during the latent and chronic phases of TLE. A, B, B6 mice during the latent phase (2 d) and at the onset of the chronic phase (14 d) after KA injection; only isolated spikes were detected during the latent phase. C, D, KA-treated RAG1-KO mice at 2 and 14 d after KA; in both cases, SRSs with similar discharge frequency and duration were detected. The boxed areas in the upper trace (10 s duration) are depicted with better time resolution. E, F, Recordings in KA-treated RAG2-KO (B6 and BALB/c strains) at 2 d after KA, showing prolonged seizures. Calibration: horizontal, 5 s; vertical, 20 mV. G, G′, Histological analysis of RAG2-KO mice by Nissl staining (G) and CD68 immunoreactivity (G′) revealed a neurodegeneration similar to wild type, with increased severity, notably in CA3. Scale bar, 250 μm.
Figure 8.
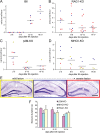
Scatter plot graphs showing the frequency of intrahippocampal SRSs in B6 (A), RAG1-KO (B), β2M-KO (C), and MHCII-KO (D) mice over time. Each mouse is represented by a different symbol. The color denotes the severity of the lesion, as depicted with a representative image in E (yellow, mild lesion; blue, moderate lesion; red, severe lesion). In D, the mouse depicted with an empty symbol died before tissue collection. At each time point on the _x_-axis, the median seizure frequency over two to three consecutive recording sessions is given for every mouse. The horizontal lines denote the overall median. A, Note the absence of SRSs up to 12–14 d after KA in B6 mice. B, In contrast, SRSs were detected already during the first recording session in all RAG1-KO mice. The frequency was variable between animals but declined at 14–17 d after KA. C, β2M-KO mice also showed seizure activity during the first recording session; thereafter, seizure frequency declined regardless of lesion severity, with the exception of a single mouse with a mild lesion. D, In MHCII-KO mice, SRSs occurred early on, with an apparent correlation between lesion severity and SRS frequency. E, Cresyl violet staining of the ipsilateral KA-injected hippocampus depicting representative examples of lesion severity seen after EEG recordings in KA-treated mice. F, Histogram of average seizure duration (mean ± SD) in the three lines of mutant mice, for three time points after KA injection. Two-way ANOVA analysis revealed no significant difference. Scale bar, 200 μm.
Figure 9.
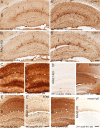
KA injection causes a local inflammatory response in both B6 and RAG1-KO mice, with overexpression of ICAM-1 in vascular endothelium, focal BBB disruption, and microglia activation. A–C, Comparison of ICAM-1 immunoreactivity in B6 and RAG1-KO mice in the ipsilateral (ipsi) (KA-injected) and contralateral (contra) hippocampus, as seen after 1 d (A, A′; B, B′) and 14 d (C, C′) after KA injection. Pronounced increase in staining intensity in vascular endothelium of the lesioned hippocampus is evident acutely in both genotypes. At 14 d after KA (C, C′), ICAM-1 immunoreactivity is increased further, reflecting strong expression in glial cells. D, D′, Staining for fibrinogen reveals focal extravasation in the ispilateral hippocampus and along the needle track in the overlaying cortex, whereas the contralateral side of the same section shows very little immunoreactivity, as illustrated for a RAG1-KO mice. Note the relative sparing of the CA2 sector (arrow) and of the dentate gyrus. E, E′, Similar acute activation of microglial cells in the lesioned hippocampal formation, as seen in both genotypes by CD68 staining at 24 h after KA injection. The background in the section from B6 mice is attributable to IgGs in the damaged tissue, as confirmed by incubation of sections with secondary anti-mouse IgG antibodies (F, F′). The absence of IgGs in RAG1-KO mice (devoid of B- and T-lymphocytes) completely prevents this nonspecific staining. Scale bars: All panels, 100 μm.
Similar articles
- Adoptive transfer of T lymphocytes in immunodeficient mice influences epileptogenesis and neurodegeneration in a model of temporal lobe epilepsy.
Deprez F, Zattoni M, Mura ML, Frei K, Fritschy JM. Deprez F, et al. Neurobiol Dis. 2011 Nov;44(2):174-84. doi: 10.1016/j.nbd.2011.06.011. Epub 2011 Jul 12. Neurobiol Dis. 2011. PMID: 21757006 - Microglia modulate the structure and function of the hippocampus after early-life seizures.
Andoh M, Ikegaya Y, Koyama R. Andoh M, et al. J Pharmacol Sci. 2020 Dec;144(4):212-217. doi: 10.1016/j.jphs.2020.09.003. Epub 2020 Sep 15. J Pharmacol Sci. 2020. PMID: 33070840 Review. - Are you in or out? Leukocyte, ion, and neurotransmitter permeability across the epileptic blood-brain barrier.
Janigro D. Janigro D. Epilepsia. 2012 Jun;53 Suppl 1(0 1):26-34. doi: 10.1111/j.1528-1167.2012.03472.x. Epilepsia. 2012. PMID: 22612806 Free PMC article. Review.
Cited by
- Microglial repopulation model reveals a robust homeostatic process for replacing CNS myeloid cells.
Varvel NH, Grathwohl SA, Baumann F, Liebig C, Bosch A, Brawek B, Thal DR, Charo IF, Heppner FL, Aguzzi A, Garaschuk O, Ransohoff RM, Jucker M. Varvel NH, et al. Proc Natl Acad Sci U S A. 2012 Oct 30;109(44):18150-5. doi: 10.1073/pnas.1210150109. Epub 2012 Oct 15. Proc Natl Acad Sci U S A. 2012. PMID: 23071306 Free PMC article. - Microglial proliferation and monocyte infiltration contribute to microgliosis following status epilepticus.
Feng L, Murugan M, Bosco DB, Liu Y, Peng J, Worrell GA, Wang HL, Ta LE, Richardson JR, Shen Y, Wu LJ. Feng L, et al. Glia. 2019 Aug;67(8):1434-1448. doi: 10.1002/glia.23616. Epub 2019 Apr 5. Glia. 2019. PMID: 31179602 Free PMC article. - Structural, Molecular, and Functional Alterations of the Blood-Brain Barrier during Epileptogenesis and Epilepsy: A Cause, Consequence, or Both?
Löscher W, Friedman A. Löscher W, et al. Int J Mol Sci. 2020 Jan 16;21(2):591. doi: 10.3390/ijms21020591. Int J Mol Sci. 2020. PMID: 31963328 Free PMC article. Review. - Mapping epileptic activity: sources or networks for the clinicians?
Pittau F, Mégevand P, Sheybani L, Abela E, Grouiller F, Spinelli L, Michel CM, Seeck M, Vulliemoz S. Pittau F, et al. Front Neurol. 2014 Nov 5;5:218. doi: 10.3389/fneur.2014.00218. eCollection 2014. Front Neurol. 2014. PMID: 25414692 Free PMC article. Review. - Blood-Brain Barrier Deterioration and Hippocampal Gene Expression in Polymicrobial Sepsis: An Evaluation of Endothelial MyD88 and the Vagus Nerve.
Honig G, Mader S, Chen H, Porat A, Ochani M, Wang P, Volpe BT, Diamond B. Honig G, et al. PLoS One. 2016 Jan 20;11(1):e0144215. doi: 10.1371/journal.pone.0144215. eCollection 2016. PLoS One. 2016. PMID: 26790027 Free PMC article.
References
- Antonucci F, Di Garbo A, Novelli E, Manno I, Sartucci F, Bozzi Y, Caleo M. Botulinum neurotoxin E (BoNT/E) reduces CA1 neuron loss and granule cell dispersion, with no effects on chronic seizures, in a mouse model of temporal lobe epilepsy. Exp Neurol. 2008;210:388–401. - PubMed
- Arabadzisz D, Antal K, Parpan F, Emri Z, Fritschy JM. Epileptogenesis and chronic seizures in a mouse model of temporal lobe epilepsy are associated with distinct EEG patterns and selective neurochemical alterations in the contralateral hippocampus. Exp Neurol. 2005;194:76–90. - PubMed
- Batchelor PE, Liberatore GT, Wong JY, Porritt MJ, Frerichs F, Donnan GA, Howells DW. Activated macrophages and microglia induce dopaminergic sprouting in the injured striatum and express brain-derived neurotrophic factor and glial cell line-derived neurotrophic factor. J Neurosci. 1999;19:1708–1716. - PMC - PubMed
Publication types
MeSH terms
Substances
LinkOut - more resources
Full Text Sources
Other Literature Sources
Molecular Biology Databases
Research Materials
Miscellaneous
