TRIP8b regulates HCN1 channel trafficking and gating through two distinct C-terminal interaction sites - PubMed (original) (raw)
TRIP8b regulates HCN1 channel trafficking and gating through two distinct C-terminal interaction sites
Bina Santoro et al. J Neurosci. 2011.
Abstract
Hyperpolarization-activated cyclic nucleotide-regulated (HCN) channels in the brain associate with their auxiliary subunit TRIP8b (also known as PEX5R), a cytoplasmic protein expressed as a family of alternatively spliced isoforms. Recent in vitro and in vivo studies have shown that association of TRIP8b with HCN subunits both inhibits channel opening and alters channel membrane trafficking, with some splice variants increasing and others decreasing channel surface expression. Here, we address the structural bases of the regulatory interactions between mouse TRIP8b and HCN1. We find that HCN1 and TRIP8b interact at two distinct sites: an upstream site where the C-linker/cyclic nucleotide-binding domain of HCN1 interacts with an 80 aa domain in the conserved central core of TRIP8b; and a downstream site where the C-terminal SNL (Ser-Asn-Leu) tripeptide of the channel interacts with the tetratricopeptide repeat domain of TRIP8b. These two interaction sites play distinct functional roles in the effects of TRIP8b on HCN1 trafficking and gating. Binding at the upstream site is both necessary and sufficient for TRIP8b to inhibit channel opening. It is also sufficient to mediate the trafficking effects of those TRIP8b isoforms that downregulate channel surface expression, in combination with the trafficking motifs present in the N-terminal region of TRIP8b. In contrast, binding at the downstream interaction site serves to stabilize the C-terminal domain of TRIP8b, allowing for optimal interaction between HCN1 and TRIP8b as well as for proper assembly of the molecular complexes that mediate the effects of TRIP8b on HCN1 channel trafficking.
Figures
Figure 1.
Contribution of HCN1 upstream and downstream binding sites to the interaction with TRIP8b. Western blots show binding of HCN1, its deletion mutants, and other membrane proteins to wild-type TRIP8b(1b-2) assessed by coimmunoprecipitation from Xenopus oocyte extracts. Oocytes were coinjected with TRIP8b cRNA (0.2 μg/μl) and cRNAs (at indicated concentration) of various constructs, all tagged with GFP: GFP-HCN1 (1.0 μg/μl), GFP-HCN1ΔSNL (1.0 μg/μl), GFP-HCN1ΔCX (0.1 μg/μl), GFP-HCN1ΔCNBD (0.1 μg/μl), GFP-CNGA1 (0.5 μg/μl), and CD8-GFP-HCN1776–910 (0.5 μg/μl). The left column shows Western blot using GFP antibody as measure of input signal. The middle column shows the TRIP8b input signal using an anti-TRIP8b antibody. The right column shows the amount of target protein coimmunoprecipitated with TRIP8b antibody (Western blot using GFP antibody). Note that exposure times are directly comparable down each column, but not along each row. The two bands in the CD8-GFP-HCN1776–910 samples likely represent the unglycosylated (lower) and glycosylated (upper) forms of the CD8 receptor moiety (Pascale et al., 1992). Individual bands have been cut from intact gel pictures and aligned to allow direct comparison of intensities for wild-type and mutant constructs with differing molecular weights. Relevant HCN1 channel domains and amino acid positions are indicated in the icons on the left (black, transmembrane domain; orange, C-linker region; purple, cyclic nucleotide binding domain; light green, C-terminal SNL tripeptide).
Figure 2.
Functional assay of the interaction between TRIP8b(1b-2) and the HCN1 extreme C terminus in live cells. A–D, Live confocal imaging of Xenopus oocytes injected with cRNA encoding either a GFP-HCN1 (A) or a CD8-GFP-HCN1776–910 fusion protein alone (B), or in combination with TRIP8b(1b-2) (C, D). A redistribution of the GFP fluorescence into distinct puncta is visible in both cases, indicating the ability of TRIP8b(1b-2) to alter the localization of both fusion proteins. E, Coexpression of TRIP8b(1b-2) with a CD8-GFP fusion protein lacking the C-terminal domain of HCN1 does not show such redistribution, indicating that the action of TRIP8b(1b-2) is specifically dependent on its binding to the target HCN1776–910 sequence.
Figure 3.
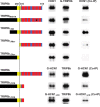
Contribution of TRIP8b upstream and downstream binding sites to the interaction with HCN1. Western blots show binding of a set of TRIP8b(1b-2) mutants to wild-type HCN1 assessed by coimmunoprecipitation from Xenopus oocyte extracts, as in Figure 1. Oocytes were coinjected with cRNA encoding HCN1 (0.5 μg/μl), GFP-HCN1 (1.0 μg/μl), or GFP-HCN1ΔCX (0.1 μg/μl), as indicated, and cRNA for TRIP8b N-terminally tagged with GFP (GFP-TRIP8b; 0.2 μg/μl, first five rows) or untagged TRIP8b (0.2 μg/μl, last three rows). Left column, HCN1 input signal (Western blot using HCN1 antibody for first five rows or GFP antibody for last three rows). Middle column, TRIP8b input signal (Western blot using GFP antibody for first five rows or TRIP8b antibody for last three rows). Right column, amount of HCN1 coimmunoprecipitated with TRIP8b (immunoprecipitation performed using anti-GFP for first five rows or anti-TRIP8b antibody for last three rows). As in Figure 1, exposure times are directly comparable down each column, but not along each row. Individual bands have been cut from intact gel pictures and aligned to allow direct comparison of intensities for wild-type and mutant constructs with differing molecular weights. Relevant protein domains and amino acid positions are indicated in the icons on the left. The black color denotes the N-terminal region that is unique to TRIP8b. The blue color denotes the region of TRIP8b that is homologous to PEX5, with the red squares representing the tetratricopeptide repeats. The yellow square represents a highly conserved core region, homologous to the corresponding region of PEX5, immediately preceding the TPR repeats (see supplemental Fig. 1, available at
as supplemental material). The vertical dotted line marks the position of residue 272 in isoform TRIP8b(1b-2), corresponding to residue 259 in isoform TRIP8b(1a-4).
Figure 4.
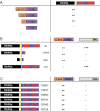
Minimal HCN1 and TRIP8b domains required for binding at the upstream and downstream interaction sites. The binding activity of a set of HCN1 and TRIP8b fragments was assessed using the yeast two-hybrid assay. Activity was detected by transactivation of a GFP reporter gene. ++, Strong fluorescence; +++, very strong fluorescence; −, no detectable fluorescence. A, Binding of TRIP8b to HCN1 C-linker and CNBD region. The TRIP8b construct (see Materials and Methods) failed to interact with the CNBD alone, but showed strong binding to the CNBD plus two (E and F), four (C–F) or all six C-linker α helixes (A–F). B, Binding of different TRIP8b wild-type and mutant constructs to the HCN1 C-linker/CNBD region (HCN1390–611) or extreme C-terminal 134 aa region, including the SNL tripeptide (HCN1776–910). C, Binding of TRIP8b bearing different TPR domain point mutations to HCN1 C-linker/CNBD or extreme C-terminus regions (as in B). All TPR mutants prevented interaction with the extreme C terminus of HCN1 but did not alter binding to the C-linker/CNBD fragment. TRIP8b numbering is based on isoform TRIP8b(1b-2), as used in Figure 3 (see Materials and Methods).
Figure 5.
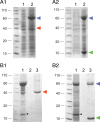
Association of TRIP8bmini and HCN2470–672 fragments in bacterial lysates. A1, A2, Coexpression of the MBP-tagged HCN2 C-linker/CNBD region (HCN2470–672) with either Strep-tagged TRIP8bΔNter (A1) or TRIP8bmini (A2) in E. coli cells. Coomassie staining following SDS/PAGE shows uninduced bacterial lysate (1) and IPTG-induced bacterial lysate (2). In each case, an amount corresponding to 100 μl of bacterial culture was loaded per lane. Blue arrowhead marks position of MBP-HCN2 band, red arrowhead Strep-TRIP8bΔNter and green arrowhead Strep-TRIP8bmini. B1, B2, Bacterial lysates from cells coexpressing MBP-HCN2 and Strep-TRIP8bΔNter (B1) or MBP-HCN2 and Strep-TRIP8bmini (B2) were loaded onto a Strep-Tactin column for Strep-tag purification. Equivalent samples were analyzed by Coomassie staining following SDS-PAGE separation, at the following stages: flow-through (1), last wash (2), eluate (3). The MBP-HCN2 fragment is found in the eluate along with the purified Strep-TRIP8bmini fragment, indicating the formation of a stable complex between the two proteins, but not with the purified Strep-TRIP8bΔNter fragment which lacks the conserved core region required for upstream site interaction. Labeling as in A. Asterisks mark the band corresponding to the lysozyme protein, which is added during the lysis stage. Molecular weight marker positions are indicated to the left of each panel.
Figure 6.
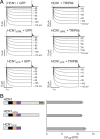
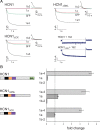
TRIP8b inhibition of HCN1 opening is not affected by deletion of HCN1 extreme C terminus. TRIP8b(1a-4) (0.2 μg/μl) or GFP as a baseline control (0.2 μg/μl) were coinjected in Xenopus oocytes with wild-type HCN1 (0.5 μg/μl), HCN1ΔSNL (0.5 μg/μl), or HCN1ΔCX (0.1 μg/μl). A, Two-microelectrode voltage-clamp current traces elicited from a holding potential of −30 mV to a range of test potentials between −15 and −115 mV in 10 mV decrements (as indicated), followed by a depolarizing step to 0 mV. Note that TRIP8b coexpression slows the rate of current activation and shifts opening to more negative potentials. B, Population data showing effect of TRIP8b to shift voltage at which channels are half activated (V1/2). ΔV1/2 was calculated by subtracting V1/2 values obtained when each HCN1 construct was coexpressed with GFP from corresponding V1/2 values when same HCN1 constructs were coexpressed with TRIP8b(1a-4). Note that V1/2 values used for subtraction were always obtained from the same batch of oocytes to minimize variability. Error bars show SEM. Mean ΔV1/2 values ± SEM (n = number of observations) are as follows: HCN1, 11.5 ± 0.5 mV (n = 26, GFP; n = 26, TRIP8b); HCN1ΔSNL, 11.3 ± 0.4 mV (n = 21, GFP; n = 21, TRIP8b); HCN1ΔCX, 12.5 ± 0.5 mV (n = 28, GFP; n = 28, TRIP8b).
Figure 7.
Effect of various TRIP8b(1a-4) mutants on the gating of wild-type HCN1. Xenopus oocytes were injected with cRNA encoding wild-type or mutant TRIP8b(1a-4) (0.2 μg/μl) or GFP as a baseline control (0.2 μg/μl), together with cRNA encoding wild-type HCN1 (0.5 μg/μl). Population data show the difference between the V1/2 observed when HCN1 was coexpressed with GFP and the V1/2 when HCN1 was coexpressed with indicated TRIP8b construct, with data points matched by batch of oocytes as described for Figure 6. Specific residue numbers for mutations introduced in the background of isoform TRIP8b(1a-4) are provided in Materials and Methods. Mean ΔV1/2 values ± SEM (n) are as follows: TRIP8b, 11.5 ± 0.5 mV (n = 26, GFP; n = 26, TRIP8b); TRIP8bΔNX, 10.9 ± 0.5 mV (n = 30, GFP; n = 30, TRIP8bΔNX); TRIP8bΔNter, 0.7 ± 0.7 mV (n = 11, GFP; n = 11, TRIP8bΔNter); TRIP8bΔint, 0.1 ± 0.6 mV (n = 16, GFP; n = 16, TRIP8bΔint); TRIP8bNK, 9.1 ± 0.8 mV (n = 12, GFP; n = 12, TRIP8bNK); TRIP8bΔTPR, 11.7 ± 0.5 mV (n = 18, GFP; n = 18, TRIP8bΔTPR).
Figure 8.
Characterization of a minimal TRIP8b domain that inhibits HCN1 gating using TRIP8b-HCN1 fusion proteins. Shift in ΔV1/2 produced when wild-type or mutant TRIP8b(1a-4) was fused to the N terminus of HCN1. ΔV1/2 values obtained relative to V1/2 of GFP-HCN1 fusion construct. All constructs expressed using cRNA injections in Xenopus oocytes (HCN1 fusions, 0.5 μg/μl; HCN1ΔCX fusions, 0.2 μg/μl). Population data show the difference between the V1/2 obtained when HCN1 was fused to GFP and the V1/2 when HCN1 was fused to indicated TRIP8b construct. All data points were matched by batch of oocytes, as above. Mean ΔV1/2 values ± SEM (n) are as follows: TRIP8b-HCN1, 13.8 ± 0.9 mV (n = 14, GFP-HCN1; n = 14, 1a4-HCN1); TRIP8bmini-HCN1, 14.7 ± 0.7 mV (_n_=14, GFP-HCN1; n = 14, mini-HCN1); TRIP8bΔint-HCN1, 4.5 ± 0.6 mV (n = 12, GFP-HCN1; n = 12, Δint-HCN1); TRIP8bmini-HCN1ΔCX, 12.6 ± 0.4 mV (n = 14, GFP-HCN1ΔCX; n = 14, mini-HCN1ΔCX); TRIP8bΔint-HCN1ΔCX, 2.1 ± 0.5 mV (n = 14, GFP-HCN1ΔCX; n = 14, Δint-HCN1ΔCX).
Figure 9.
HCN1 C-terminal deletions differentially alter the ability of three TRIP8b isoforms to regulate HCN1 surface expression. Xenopus oocytes were injected with cRNA encoding wild-type HCN1 (0.5 μg/μl), HCN1ΔSNL (0.5 μg/μl) or HCN1ΔCX (0.1 μg/μl) together with cRNA encoding one of the indicated TRIP8b splice variants (0.2 μg/μl) or GFP (0.2 μg/μl) to provide a baseline control. Recordings were performed 3 d after injection; two-microelectrode voltage-clamp current traces obtained as in Figure 6. A, Sample current traces elicited from a holding potential of −30 mV to a test potential of −105 mV shown for HCN1, HCN1ΔSNL, or HCN1ΔCX (as indicated) coexpressed with GFP (green traces), TRIP8b(1a-4) (black traces), TRIP8b(1a) (red traces), or TRIP8b(1b-2) (blue traces). Tail current traces are shown at an expanded scale. Lower right, Current traces obtained at the −105 mV test potential upon coexpression of TRIP8b(1b-2) with HCN1 or HCN1ΔSNL. B, Maximal tail current amplitude (_I_max) for HCN1 constructs coexpressed with a given TRIP8b isoform normalized by maximal tail current amplitude when the same channel construct was coexpressed with GFP. As in Figure 6, data points were matched by batch of oocytes. Error bars show SEM. Mean normalized _I_max values ± SEM (n) are as follows: HCN1 + TRIP8b(1a-4), 5.35 ± 0.27 (n = 67, GFP; n = 70, 1a-4); HCN1 + TRIP8b(1a), 0.14 ± 0.01 (n = 56, GFP; n = 60, 1a); HCN1 + TRIP8b(1b-2), undetectable current (n = 34, GFP; n = 27, 1b-2); HCN1ΔSNL + TRIP8b(1a-4), 4.65 ± 0.45 (n = 15, GFP; n = 14, 1a-4); HCN1ΔSNL + TRIP8b(1a), 1.36 ± 0.1 (n = 15, GFP; n = 15, 1a); HCN1ΔSNL + TRIP8b(1b-2), 0.05 ± 0.005 (n = 15, GFP; n = 15, 1b-2); HCN1ΔCX + TRIP8b(1a-4), 4.15 ± 0.25 (n = 17, GFP; n = 16, 1a-4); HCN1ΔCX + TRIP8b(1a), 0.98 ± 0.06 (n = 17, GFP; n = 17, 1a); HCN1ΔCX + TRIP8b(1b-2), undetectable current (n = 13, GFP; n = 13, 1b-2).
Figure 10.
Both downstream and upstream interaction sites in TRIP8b contribute to regulation of HCN1 trafficking by the three TRIP8b isoforms. Population data showing maximal tail current amplitudes (_I_max) upon coexpression of wild-type HCN1 with the indicated mutant TRIP8b isoform, normalized to the baseline current value determined following coexpression of HCN1 with GFP control, with data points matched by batch of oocytes. As the N-terminal deletion mutants are identical for all three TRIP8b isoforms, only one set of data is shown for each mutant. Specific residue numbers for mutations introduced in the background of each isoform are provided in Materials and Methods. Mean normalized _I_max values ± SEM (n) are as follows: HCN1 + TRIP8b(1a-4), 5.35 ± 0.27 (n = 67, GFP; n = 70, 1a-4); HCN1 + TRIP8b(1a), 0.14 ± 0.01 (n = 56, GFP; n = 60, 1a); HCN1 + TRIP8b(1b-2), undetectable current (n = 34, GFP; n = 27, 1b-2); HCN1 + TRIP8bΔNX, 1.24 ± 0.09 (n = 30, GFP; n = 30, ΔNX); HCN1 + TRIP8bΔNter, 1.57 ± 0.23 (n = 11, GFP; n = 11, ΔNter); HCN1 + TRIP8b(1a-4)Δint, 2.29 ± 0.18 (n = 19, GFP; n = 23, 1a-4Δint); HCN1 + TRIP8b(1a)Δint, 2.87 ± 0.18 (n = 19, GFP; n = 23, 1aΔint); HCN1 + TRIP8b(1b-2)Δint, 0.18 ± 0.02 (n = 19, GFP; n = 23, 1b-2Δint); HCN1 + TRIP8b(1a-4)NK, 5.68 ± 0.49 (n = 12, GFP; n = 12, 1a-4 NK); HCN1 + TRIP8b(1a)NK, 2.96 ± 0.2 (n = 19, GFP; n = 23, 1aNK); HCN1 + TRIP8b(1b-2)NK, 0.07 ± 0.01 (n = 15, GFP; n = 15, 1b-2NK); HCN1 + TRIP8b(1a-4)ΔTPR, 1.13 ± 0.07 (n = 18, GFP; n = 18, 1a-4ΔTPR); HCN1 + TRIP8b(1a)ΔTPR, 0.29 ± 0.02 (n = 18, GFP; n = 18, 1aΔTPR); HCN1 + TRIP8b(1b-2)ΔTPR, undetectable current (n = 15, GFP; n = 10, 1b-2ΔTPR). One-way ANOVA was used to determine that all experimental groups, except for TRIP8bΔNX, TRIP8bΔNter, and TRIP8b(1a-4)ΔTPR, significantly differ from the GFP baseline control group (p < 0.01, Tukey's multiple-comparison test).
Figure 11.
Schematic representation of HCN1/TRIP8b interactions in the presence of intracellular trafficking factors. A, Summary of interactions between HCN1, TRIP8b, and trafficking proteins. The HCN1 channel protein is represented in gray, with C-linker helices E′ and F′ indicated by rectangles, and the C-terminal SNL sequence indicated by a circle. The TRIP8b protein is color coded as in previous figures (black, unique N-terminal region; yellow, highly conserved core domain; blue, region of homology to PEX5 with TPR repeats indicated in red). Dileucine- or tyrosine-based AP binding motifs are present in the N-terminal domain of TRIP8b, indicated by black triangles. AP complex proteins (AP-1 or AP-2) are represented in pink, positioned closely to the plasma membrane (Bonifacino and Traub, 2003), and bind to the N terminus of TRIP8b. An additional trafficking factor (potentially Rab8b), indicated in green, is shown to interact with the C-terminal TPR region of TRIP8b. Note that both of these interacting elements are hypothetical. Gating and trafficking phenotypes are indicated in each panel for their respective mutants. B, Deletion of a critical sequence within the conserved core domain of TRIP8b (Δint) results in a loss of the ability to modulate channel gating and to downregulate channel expression. A hypothetical displacement of the TRIP8b N-terminal domain is shown to impede the binding of AP complex proteins, but not of factors involved in the upregulation of HCN1 surface expression. C, Deletion of the portion of the TPR domain following the first tetratricopeptide repeat (ΔTPR) leads to a loss in the ability of TRIP8b to upregulate surface expression. We speculate that this is because required factors are unable to bind the protein's C-terminal domain. Efficient interaction at the upstream CNBD/core binding site and between the N terminus of TRIP8b and AP complex proteins would still allow for the regulation of channel gating and endocytosis. D, Deletion of the HCN1 channel's C-terminal SNL tripeptide (HCN1ΔSNL) or the N to K point mutation in the TPR domain (TRIP8bNK) results in a loss of the ability of TRIP8b to downregulate surface expression. We speculate that failure to interact at the downstream SNL/TPR binding site leads to a displacement of the C-terminal half of the TPR domain, which prevents the access of AP complex proteins to their target sequences in the TRIP8b N terminus. Interaction at the upstream CNBD/core site and with factors bound to the TPR domain that upregulate channel surface expression would not be impaired, resulting in normal gating and _I_max increase phenotypes.
Figure 12.
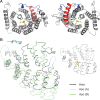
Homology model of the TRIP8b tetratricopeptide repeat domain in bound and unbound form. A, Top view (left) and bottom view (right) of homology model of TRIP8b TPR domain in complex with the HCN channel C-terminal tripeptide (−SNL, yellow stick figure representation) based on PEX5 structure. The side chains of four TRIP8b amino acid residues predicted to make critical contacts with the target peptide are shown in green stick figure representations (V391, N395, N501, R532) (Fig. 4_C_). Note that the N-terminal two helices, corresponding to the first tetratricopeptide repeat (TPR1, in red) do not contact the SNL target peptide. These helices are preserved in TRIP8bΔTPR (only the gray portion of the TPR domain is deleted in this construct). The N-terminal end of the structure is colored in blue, and corresponds to the C-terminal tail of the TRIP8bmini construct (no structural information is available N-terminal to this point). B, Homology models of different conformations assumed by the TPR domain of TRIP8b upon binding or unbinding of the SNL target peptide. The holo (bound) structure (black) is superimposed on two alternative conformations assumed by the apo (unbound) structure (light blue and green). Note that the C-terminal TPR segments rotate away from the N-terminal TPR segments, with the two halves of the TPR domain behaving as near-rigid bodies (Stanley et al., 2007). Models were constructed using the program MODELLER based on Protein Data Bank accessions 1FCH, 2C0M, and 2J9Q. Molecular figures were generated using PyMOL (DeLano, 2002). The view of the structure in B is rotated ∼90° with respect to the view shown in A, as indicated by the arrow. For orientation purposes, the holo structure is reproduced on the right, showing the position of the −SNL peptide. Structure in A corresponds to residues 297–615 of TRIP8b(1b-2), and structures in B to residues 304–615 (see supplemental Fig. 3, available at
as supplemental material). The loop between TPR3 and TPR4 (Gatto et al., 2000), as well as the loop between TPR7 and the C-terminal three-helical bundle (7C loop) (Stanley et al., 2006), have been substituted by a dotted line, as these elements are not resolved in the PEX5 structures.
Similar articles
- Trafficking and gating of hyperpolarization-activated cyclic nucleotide-gated channels are regulated by interaction with tetratricopeptide repeat-containing Rab8b-interacting protein (TRIP8b) and cyclic AMP at distinct sites.
Han Y, Noam Y, Lewis AS, Gallagher JJ, Wadman WJ, Baram TZ, Chetkovich DM. Han Y, et al. J Biol Chem. 2011 Jun 10;286(23):20823-34. doi: 10.1074/jbc.M111.236125. Epub 2011 Apr 19. J Biol Chem. 2011. PMID: 21504900 Free PMC article. - Alternatively spliced isoforms of TRIP8b differentially control h channel trafficking and function.
Lewis AS, Schwartz E, Chan CS, Noam Y, Shin M, Wadman WJ, Surmeier DJ, Baram TZ, Macdonald RL, Chetkovich DM. Lewis AS, et al. J Neurosci. 2009 May 13;29(19):6250-65. doi: 10.1523/JNEUROSCI.0856-09.2009. J Neurosci. 2009. PMID: 19439603 Free PMC article. - Regulation of axonal HCN1 trafficking in perforant path involves expression of specific TRIP8b isoforms.
Wilkars W, Liu Z, Lewis AS, Stoub TR, Ramos EM, Brandt N, Nicholson DA, Chetkovich DM, Bender RA. Wilkars W, et al. PLoS One. 2012;7(2):e32181. doi: 10.1371/journal.pone.0032181. Epub 2012 Feb 21. PLoS One. 2012. PMID: 22363812 Free PMC article. - The structure and function of TRIP8b, an auxiliary subunit of hyperpolarization-activated cyclic-nucleotide gated channels.
Han Y, Lyman KA, Foote KM, Chetkovich DM. Han Y, et al. Channels (Austin). 2020 Dec;14(1):110-122. doi: 10.1080/19336950.2020.1740501. Channels (Austin). 2020. PMID: 32189562 Free PMC article. Review. - Neurophysiology of HCN channels: from cellular functions to multiple regulations.
He C, Chen F, Li B, Hu Z. He C, et al. Prog Neurobiol. 2014 Jan;112:1-23. doi: 10.1016/j.pneurobio.2013.10.001. Epub 2013 Oct 29. Prog Neurobiol. 2014. PMID: 24184323 Review.
Cited by
- Clathrin-mediated endocytosis and adaptor proteins.
Popova NV, Deyev IE, Petrenko AG. Popova NV, et al. Acta Naturae. 2013 Jul;5(3):62-73. Acta Naturae. 2013. PMID: 24307937 Free PMC article. - Dynamic measurements for funny channels.
Puljung MC. Puljung MC. Proc Natl Acad Sci U S A. 2014 Oct 7;111(40):14320-1. doi: 10.1073/pnas.1416137111. Epub 2014 Sep 23. Proc Natl Acad Sci U S A. 2014. PMID: 25249634 Free PMC article. No abstract available. - Isoform-specific regulation of HCN4 channels by a family of endoplasmic reticulum proteins.
Peters CH, Myers ME, Juchno J, Haimbaugh C, Bichraoui H, Du Y, Bankston JR, Walker LA, Proenza C. Peters CH, et al. Proc Natl Acad Sci U S A. 2020 Jul 28;117(30):18079-18090. doi: 10.1073/pnas.2006238117. Epub 2020 Jul 9. Proc Natl Acad Sci U S A. 2020. PMID: 32647060 Free PMC article. - Searching for new targets for treatment of pediatric epilepsy.
Noam Y, Raol YH, Holmes GL. Noam Y, et al. Epilepsy Behav. 2013 Mar;26(3):253-60. doi: 10.1016/j.yebeh.2012.09.022. Epub 2012 Dec 6. Epilepsy Behav. 2013. PMID: 23219411 Free PMC article. Review. - Validation of the binding stoichiometry between HCN channels and their neuronal regulator TRIP8b by single molecule measurements.
Saponaro A, Vallese F, Porro A, Clarke OB. Saponaro A, et al. Front Physiol. 2022 Sep 26;13:998176. doi: 10.3389/fphys.2022.998176. eCollection 2022. Front Physiol. 2022. PMID: 36225302 Free PMC article.
References
- Bonifacino JS, Traub LM. Signals for sorting of transmembrane proteins to endosomes and lysosomes. Annu Rev Biochem. 2003;72:395–447. - PubMed
- Chen S, Liang MC, Chia JN, Ngsee JK, Ting AE. Rab8b and its interacting partner TRIP8b are involved in regulated secretion in AtT20 cells. J Biol Chem. 2001a;276:13209–13216. - PubMed
- DeLano WL. DeLano Scientific; 2002. The PyMOL molecular graphics system. Available at http://www.pymol.org.
- Fransen M, Amery L, Hartig A, Brees C, Rabijns A, Mannaerts GP, Van Veldhoven PP. Comparison of the PTS1- and Rab8b-binding properties of Pex5p and Pex5Rp/TRIP8b. Biochim Biophys Acta. 2008;1783:864–873. - PubMed
Publication types
MeSH terms
Substances
Grants and funding
- F32 NS064732/NS/NINDS NIH HHS/United States
- R01 NS036658/NS/NINDS NIH HHS/United States
- NS36658/NS/NINDS NIH HHS/United States
- R56 NS036658/NS/NINDS NIH HHS/United States
- F32NS064732/NS/NINDS NIH HHS/United States
- R01 NS036658-10/NS/NINDS NIH HHS/United States
LinkOut - more resources
Full Text Sources
Other Literature Sources
Molecular Biology Databases
Miscellaneous


