High-throughput, subpixel precision analysis of bacterial morphogenesis and intracellular spatio-temporal dynamics - PubMed (original) (raw)
High-throughput, subpixel precision analysis of bacterial morphogenesis and intracellular spatio-temporal dynamics
Oleksii Sliusarenko et al. Mol Microbiol. 2011 May.
Abstract
Bacteria display various shapes and rely on complex spatial organization of their intracellular components for many cellular processes. This organization changes in response to internal and external cues. Quantitative, unbiased study of these spatio-temporal dynamics requires automated image analysis of large microscopy datasets. We have therefore developed MicrobeTracker, a versatile and high-throughput image analysis program that outlines and segments cells with subpixel precision, even in crowded images and mini-colonies, enabling cell lineage tracking. MicrobeTracker comes with an integrated accessory tool, SpotFinder, which precisely tracks foci of fluorescently labelled molecules inside cells. Using MicrobeTracker, we discover that the dynamics of the extensively studied Escherichia coli Min oscillator depends on Min protein concentration, unveiling critical limitations in robustness within the oscillator. We also find that the fraction of MinD proteins oscillating increases with cell length, indicating that the oscillator has evolved to be most effective when cells attain an appropriate length. MicrobeTracker was also used to uncover novel aspects of morphogenesis and cell cycle regulation in Caulobacter crescentus. By tracking filamentous cells, we show that the chromosomal origin at the old-pole is responsible for most replication/separation events while the others remain largely silent despite contiguous cytoplasm. This surprising position-dependent silencing is regulated by division.
© 2011 Blackwell Publishing Ltd.
Figures
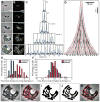
Fig. 1. Principles of MicrobeTracker operation
A. Image preparation and the sequence of morphological operations with inversion, thresholding, edge and detection algorithms are shown. A phase contrast image of C. crescentus cells (MT196) expressing ftsZ-yfp is shown as an example. Bar: 1 μm. B. Active contour model and cell mesh generation. First, the energy map is generated (shown as the background), which is converted to forces (shown as arrows) and used to move a constraint active contour. The fit is considered converged when the forces drop below a certain magnitude or after a fixed number of steps. The mesh generation starts from the centerline determination and results in a creation of a set of segments of equal length along the curved cell body. C. Cell contour determination in time-lapse sequences. The active contour starts using its position from the previous frame and adjusts to the new position and shape of the cell. After that, the program checks whether the cell has divided and if so, splits the contour. D. A fluorescence profile of FtsZ-YFP signal is calculated by integration of the signal in each segment, after which the intensity can be normalized by the area or volume of the segment. E. The principles of SpotFinder operation. Top left, original fluorescence image (LacI-CFP bound to a lacO array at the chromosomal terminus; strain MT16). Top center, the same image after processing with a bandpass filter. Top right, the same image after further processing with the ridge-removal routine. Bottom, this processed image is then used to obtain an initial guess of the position, width, and height of the spots, and finally a 2D Gaussian is fit to the original image. Bar: 1 μm.
Fig. 2. Shape analysis of constricting C. crescentus cells
Here a C. crescentus strain expressing DivJ-YFP was used (strain CJW826) in order to automatically identify the old pole of the cell where DivJ-YFP forms a tight focus. We imaged a sample of cells harvested from an exponential phase culture (14 frames, 29789 cells) and identified predivisional (constricting) cells (5200 cells). A. An example of a dividing cell outlined with MicrobeTracker. A phase contrast (top) and a CFP fluorescence (bottom) images are shown. The line extending from the pole indicates the old pole where DivJ-CFP localizes. Bar: 2 μm. B. Phase contrast intensity profile for the cell in A. The degree of constriction is defined as b/a and had to be above 0.2 (arbitrary chosen) for the cell to be considered constricting. C. Determination of the swarmer and stalked length and width of the cell used as an example in (A). The stalked (_L_ST) and swarmer (_L_SW) lengths are defined as the distance along the centerline from the old or new pole, respectively, to the lowest point of the cell profile. The stalked (_W_ST) and swarmer (_W_SW) widths are defined as the mean length of the ‘ribs’, confined within each of the two sections of the cell. D. Histogram of the ratio between the stalked and swarmer lengths (_L_ST/_L_SW) with the stalked length defined as the distance between the constriction site and the old pole while the swarmer length representes the distance between the constriction site and the new pole (mean ratio is 1.168±0.005) (mean±SEM). E. Histogram of the ratio between the stalked and swarmer widths, displaying a small but statistically significant asymmetry (mean ratio is 1.050±0.002).
Fig. 3. Tracking bacteria over multiple generations and the timing of FtsZ ring positioning
C. crescentus cells expressing FtsZ-YFP under the control of vanillic acid-inducible promoter P_van_ (strain MT196) were grown in M2G medium with vanillic acid for 4 h prior to imaging for 10 h on agarose pads containing the same medium. A. The progeny of one cell outlined in a time-lapse series of images. Bars: 2 μm. B. The same contours overlapped with FtsZ-YFP signal. C. Corresponding fluorescence profiles normalized by segment area of all the progeny, displayed by joining the poles created at each division. D. Kymographic representation of the FtsZ-YFP signal with the intensity shown as shades of grey and the cell boundaries as red lines. Arrows at the bottom indicate the old-to-new pole orientation of the cells. E. Distributions of the time gaps between cell division and the moment of FstZ-YFP localization near the cell center for stalked and swarmer cells, as determined by MicrobeTracker. F. Distributions of the time gaps between the moment of FtsZ-YFP localization near the cell center and the moment of cell division for stalked and swarmer cells. G–K. Demonstration of the effectiveness of cell outline identification in time-lapse series. G. Original phase contrast image showing a cell cluster generated after growth and division on the pad (as in A). H. Same image outlined using information from the previous time points. I. Same image processed by thresholding only. J. Same image processed using thresholding and edge detection. K. Cells detected using thresholding and edge detection but without information from the previous frame. Some cells could not be resolved because of cell boundaries not being visible enough at this cell density.
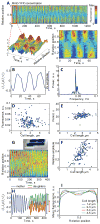
Fig. 4. Dependence of MinD oscillation dynamics on cell length
For these time-lapse experiments, YFP-MinD synthesis was induced from the lac promoter P_lac_ in E. coli cells (strain MC1000/pWM1409/pFx40) with 10 μM IPTG for 2 h prior to imaging on M9-maltose pad containing the same concentration of IPTG. A. Kymographic representation of YFP-MinD localization in a single randomly selected cell imaged for 20 min at 2.5 s interval. Signal intensity was normalized by the area of each segment. The length of the cell was normalized to 1 at each time point; the actual length increased by about 10% during the experiment. The initial 75-s segment of the kymograph is shown below in 2D and 3D representations. B. Relative cell-length-independent 1D profile of the MinD-YFP oscillations defined as the integrated intensity in one half of the cell (_I_1) minus the integrated intensity in the other half of the cell (_I_2) divided by the total intensity (_I_1+_I_2). Only the initial 75-s sequence for the cell in (A) is shown. The bar on the right indicates the limits of oscillations, which define the amplitude. C. Power spectrum of the relative 1D signal for the same cell, defined as the square of Fourier-transformed signal. The peak at zero corresponds to the offset of the mean level, whereas the peak at about 0.045 Hz corresponds to the main frequency of the oscillations. D. The dependence of YFP-MinD concentration on cell length. The data from a single representative experiment (n = 164 cells) were analyzed to control for the concentration of MinD as a possible mediator of the oscillation parameters. E. Dependence of the oscillation period on cell length for the cells from the same experiment as in (D). Infrequent outliers typically correspond to misdetected oscillations when no oscillations were present. In these particular cases, the amplitude was low and the frequency random, coming from the strongest noise harmonic. The length was defined as the mean length of the cell during the experiment. The cells that divided during the experiment were removed from consideration. F. Dependence of the relative amplitude of the oscillations (computed by integrating the largest peak in the spectrum) on cell length (n = 164 cells). G. Kymograph of a cell that divided during the time-lapse sequence. Oscillations with reduced amplitude are visible (as yellow color instead of alternating red and blue) after the septum closing event. The intensity coding is the same as in (A). H. A 1D oscillation profile for the cell in (G) with the bars indicating the limits of oscillations for the mother (blue) and two daughter cells (red and green), showing the decrease in the amplitude after division. Bar in phase contrast image: 2 μm. I. The profile of YFP-MinD averaged over time as a function of relative cell length. The profiles were calculated for each cell and averaged for the groups of cells falling into 4 intervals of cell length.
Fig. 5. Dependence of MinD dynamics on protein concentration
Here Δ_min_ cells expressing YFP-MinD and MinE from an IPTG-inducible promoter on a plasmid (strain CJW3672) were imaged while being induced with different concentrations of IPTG. The cells were grown in M9-glycerol, preinduced with IPTG for 4 h and imaged on agarose-padded slides containing M9-glycerol and IPTG at 3 s (20 μM IPTG) or 2.5 s (100 μM IPTG) intervals. A. Typical examples of cells imaged at 20 μM IPTG showing oscillations (top: cell with a single YFP-MinD band, bottom: elongated cell with multiple YFP-MinD bands). B. Typical examples of cells imaged at 100 μM IPTG showing stochastic switching of YFP-MinD signal (top: cell with a single YFP-MinD band, bottom: elongated cell with multiple YFP-MinD bands). C. Plot of YFP-MinD fluorescence intensity as a function of IPTG concentration after 4 h induction.
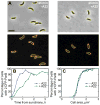
Fig. 6. Effect of A22 on origin segregation in C. crescentus
A. Phase contrast and fluorescence images of MT190 cells carrying CFP-ParB after growth in liquid M2G cultures in the presence or absence of A22 (10 μg/ml) for 2 h after synchrony. Cell outlines (yellow) and CFP-ParB foci (red) detected by SpotFinder are shown. Bar: 2 μm. B. Plot showing the percentage of untreated and A22-treated cells with two visible origins of replication as a function of time after synchrony. C. Plot showing the percentage of untreated and A22-treated cells (same as in B) with two visible origins of replication as a function of cell area.
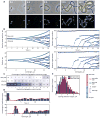
Fig. 7. Dynamics of origin replication and segregation in C. crescentus cells blocked for cell division
In this experiment, CJW3673 cells (CB15N _ftsZ::Pxyl_-_ftsZ parB::cfp_-parB) were depleted of FtsZ following synchrony, after which CFP-ParB was imaged by time-lapse microscopy. A. Examples of a representative filamenting cell outlined by MicrobeTracker at selected time points. B. For the same cell, the positions of chromosomal origins (using CFP-ParB as a proxy) are shown over time inside the cell in absolute (left) and relative (right) coordinates. The bottom graphs show the same, but plotted versus the logarithm of cell length to compensate for the differences in growth rate during the experiment. Green lines outline the length of the cell. C. Segregation bias shown for all cells in a single representative experiment (36 cells). Here the replication and separation events of origins were sorted chronologically for each cell, and the fractions of such events for the old-pole, new-pole, or internal origins are shown in percent. D. Probability of origin replication/separation events for all cells in the same experiment (fraction of origins that have replicated) as a function of time (top) and cell length (bottom). E. Distribution of the spacings between chromosomal origins. The spacings were labeled based on the location of their centers in the cell (see schematic on the right) to examine whether there was a bias between the old-pole and new-pole sides of the cell.
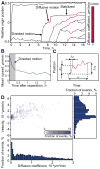
Fig. 8. Motion analysis of the origins
A. Motion analysis of the origins for the cell in Fig. 7A and B. Three distinct regimes were identified. ‘Directed’ motion was defined as the high speed regime immediately following replication/separation events (see also panel B). The other motion types were analyzed based on diffusion analysis. A sliding window (of 10 time frames long) was placed on the origin tracks and the motion characterized within each position of the window as random motion with the diffusion coefficient D superimposed with a drift velocity V (panels C and D). The diffusion coefficient is shown as line color. B. Definition of ‘directed’ motion. This motion corresponds to the regime of high speed immediately following origin separation (shaded area). C. Diffusion analysis of the origins. The tracks were analyzed based on diffusion analysis: a sliding window was placed on the origin tracks and the motion characterized as a random motion with the diffusion coefficient D superimposed with a drift velocity V, calculated within each window using the shown variables (see Experimental Procedures). D. Histograms of this diffusion analysis. Two distinct peaks corresponding to diffusive motion and the stabilized state are clearly seen on the 2D histogram and on its projections to both V and D axes. Based on the analysis, we identified two distinct regimes: ‘diffusive motion’ is characterized by intermediate velocity and high diffusion, whereas ‘stabilized state’ is characterized by both low velocity and diffusion.
Comment in
- MicrobeTracker: quantitative image analysis designed for the smallest organisms.
Garner EC. Garner EC. Mol Microbiol. 2011 May;80(3):577-9. doi: 10.1111/j.1365-2958.2011.07580.x. Epub 2011 Mar 24. Mol Microbiol. 2011. PMID: 21504490 No abstract available.
References
- Ackermann M, Stearns SC, Jenal U. Senescence in a bacterium with asymmetric division. Science. 2003;300:1920. - PubMed
Publication types
MeSH terms
Substances
Grants and funding
- GM065835/GM/NIGMS NIH HHS/United States
- R01 GM065835/GM/NIGMS NIH HHS/United States
- GM076698/GM/NIGMS NIH HHS/United States
- HHMI/Howard Hughes Medical Institute/United States
- R01 GM076698/GM/NIGMS NIH HHS/United States
LinkOut - more resources
Full Text Sources
Other Literature Sources


