Extensive personal human gut microbiota culture collections characterized and manipulated in gnotobiotic mice - PubMed (original) (raw)
Extensive personal human gut microbiota culture collections characterized and manipulated in gnotobiotic mice
Andrew L Goodman et al. Proc Natl Acad Sci U S A. 2011.
Abstract
The proportion of the human gut bacterial community that is recalcitrant to culture remains poorly defined. In this report, we combine high-throughput anaerobic culturing techniques with gnotobiotic animal husbandry and metagenomics to show that the human fecal microbiota consists largely of taxa and predicted functions that are represented in its readily cultured members. When transplanted into gnotobiotic mice, complete and cultured communities exhibit similar colonization dynamics, biogeographical distribution, and responses to dietary perturbations. Moreover, gnotobiotic mice can be used to shape these personalized culture collections to enrich for taxa suited to specific diets. We also demonstrate that thousands of isolates from a single donor can be clonally archived and taxonomically mapped in multiwell format to create personalized microbiota collections. Retrieving components of a microbiota that have coexisted in single donors who have physiologic or disease phenotypes of interest and reuniting them in various combinations in gnotobiotic mice should facilitate preclinical studies designed to determine the degree to which tractable bacterial taxa are able to transmit donor traits or influence host biology.
Conflict of interest statement
The authors declare no conflict of interest.
Figures
Fig. 1.
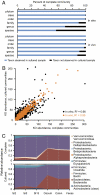
Comparison of the taxonomic representation of bacterial species and gene content in complete versus cultured human fecal microbial communities before and after their introduction into gnotobiotic mice. (A) 16S rRNA sequences from complete microbiota were compared with those identified from microbial communities cultured from the same human donors. At each taxonomic level, the proportion of reads in the complete community belonging to a taxonomic group observed in the cultured sample is shown in blue; the proportion of reads belonging to a taxonomic group not observed in the cultured sample (or lacking taxonomic assignment) is shown in black. Data shown are the average of two unrelated human donors. In vitro samples refer to comparisons between human fecal samples and plated material. In vivo samples refer to comparisons between gnotobiotic mice colonized with a complete human fecal microbiota and mice colonized with the readily cultured microbes from the same human fecal sample. (B) Annotated functions identified in the microbiomes of complete and cultured human gut communities. Each point represents a KO designation plotted by relative abundance (average across two donors, per 100,000 sequencing reads). Black points represent KO comparisons between the in vitro samples; orange points represent comparisons between in vivo samples. (C) The distribution of taxa and their relative abundance along the length of the intestine are similar in gnotobiotic mice colonized with complete or cultured human gut communities. Relative abundances of class-level taxa at six locations are shown; data represent the average of mice colonized from two unrelated donors. Si, small intestine divided into 16 equal-size segments and sampled at Si-2 (proximal), Si-5 (middle), and Si-13 (distal). PCoA suggests that gut biogeography, rather than donor or culturing, explains the majority (58%) of variance between samples (
Fig. S3 A_–_C
).
Fig. 2.
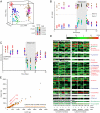
Human gut microbial communities composed only of cultured members exhibit in vivo dynamics similar to those observed in their complete counterparts. (A) PCoA of UniFrac distances between 16S rRNA datasets generated from fecal samples from gnotobiotic mice, colonized with complete or cultured human fecal microbial communities from two unrelated donors and sampled over time. From day 33–46, mice were switched from their standard LF/PP chow to a high-fat, high-sugar Western diet. Time series analysis of community structure as viewed along the first two principal coordinates from A shows that interpersonal (donor) differences separated communities on PC1 (B), and host diet separated communities on PC2 (C). Principal coordinate 3 (PC3) separated samples from mice colonized with complete communities from those colonized with cultured populations (
Fig. S4_A_
). Nonphylogenetic distance metrics produced similar results (
Fig. S4 D_–_H
). (D) Evidence that the community response to diet is driven by readily cultured bacteria and that members of the same taxonomic group manifest distinct responses to diet perturbations. Species-level taxa significantly influenced by diet (Student's t test P ≤ 0.01 after Bonferroni correction; n = 97 taxa tested) in either the complete communities (blue names), the cultured communities (green names), or both (red names) are plotted over time (arrows). Each column represents the average relative abundance in fecal samples harvested from three to five individually caged mice that were sampled at various times: (i) during the initial LF/PP diet phase; (ii) during the subsequent shift to the Western diet; and (iii) upon return to LF/PP chow. Members of family-level groups with at least one diet-responsive species are shown (excluding rare species with average abundance <0.1% across each time point). The names of all taxa are shown in
Fig. S5
. (E) The functional gene repertoire in the fecal microbiomes of humanized gnotobiotic mice. Each point represents a KEGG level 2 pathway; the number of hits to each pathway per 100,000 shotgun pyrosequencing reads is plotted for mice consuming LF/PP (x axis) or Western (y axis) diets. Data represent the averages of mice colonized with microbial communities from two unrelated donors. The results show that the fecal microbiome associated with the Western diet is enriched for genes in pathways associated with carbohydrate phosphotransferase systems (PTS; red arrows) both in mice colonized with complete (uncultured) human gut communities (black points) and mice colonized with communities of readily cultured members (orange points). Donor-specific data and results from alternate annotation schemes are shown in
Fig. S6
and
Tables S3–S5
.
Fig. 3.
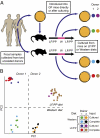
The community composition of microbes cultured from humanized gnotobiotic mice can be reshaped by altering host diet. (A) Culture collections were generated from fecal samples obtained from gnotobiotic mice colonized with complete or cultured gut microbial communities from either of two unrelated human donors and maintained on LF/PP or Western diets. (B) PCoA of nonphylogenetic (binary Jaccard) distances between cultured samples indicates that manipulation of host diet can be used to shape the composition of communities recovered in culture from these animals. Analysis of phylogenetic (UniFrac) distances between samples produced similar clustering by donor and host diet (
Fig. S7
).
Fig. 4.
Personal culture collections archived in a clonally arrayed, taxonomically defined format. (A) After limiting dilution of the sample into 384-well trays to the point at which most turbid wells are clonal, a two-step, barcoded pyrosequencing scheme allows each culture well to be associated with its corresponding bacterial 16S rRNA sequence. In the first round of PCR, one of the V2-directed 16S rRNA primers incorporates 1 of 96 error-correcting barcodes (BC1, highlighted in red) that designates the location (row and column) within a quadrant of the 384-well tray where the sample resides. The primer also contains a 12-bp linker (blue). All amplicons generated from all wells in a given quadrant from a single plate then are pooled and subjected to a second round of PCR in which one of primers, which targets the linker sequence, incorporates another error-correcting barcode (BC2; green) that designates the quadrant and plate from which the samples were derived, plus an oligonucleotide (gray) used for 454 pyrosequencing. Amplicons generated from the second round of PCR then are pooled from multiple trays and subjected to multiplex pyrosequencing. This approach allows unambiguous assignment of 16S rRNA reads to well and plate locations using a minimum number of barcodes and primers; e.g., 96 BC1 primers and 96 BC2 primers allow 962 (9,216) wells to be analyzed. (B) Representation of the original (complete) microbial community in the arrayed strain collection.
Comment in
- Microbiome: Human gut microbiota can be readily cultured, manipulated and archived.
Wood NJ. Wood NJ. Nat Rev Gastroenterol Hepatol. 2011 May 4;8(5):241. doi: 10.1038/nrgastro.2011.60. Nat Rev Gastroenterol Hepatol. 2011. PMID: 21701447 No abstract available.
References
- Razumov AS. Mikrobiologija. 1932;1:131–146.
Publication types
MeSH terms
Grants and funding
- P01 DK078669/DK/NIDDK NIH HHS/United States
- R01 DK030292/DK/NIDDK NIH HHS/United States
- R01 DK070977/DK/NIDDK NIH HHS/United States
- K01DK089121/DK/NIDDK NIH HHS/United States
- DK30292/DK/NIDDK NIH HHS/United States
- F32AI078628/AI/NIAID NIH HHS/United States
- F32 AI078628/AI/NIAID NIH HHS/United States
- DK70977/DK/NIDDK NIH HHS/United States
- T32-HD043010/HD/NICHD NIH HHS/United States
- R37 DK030292/DK/NIDDK NIH HHS/United States
- K01 DK089121/DK/NIDDK NIH HHS/United States
- T32 HD043010/HD/NICHD NIH HHS/United States
- DK78669/DK/NIDDK NIH HHS/United States
LinkOut - more resources
Full Text Sources
Other Literature Sources
Medical


