The cilia protein IFT88 is required for spindle orientation in mitosis - PubMed (original) (raw)
The cilia protein IFT88 is required for spindle orientation in mitosis
Benedicte Delaval et al. Nat Cell Biol. 2011 Apr.
Abstract
Cilia dysfunction has long been associated with cyst formation and ciliopathies. More recently, misoriented cell division has been observed in cystic kidneys, but the molecular mechanism leading to this abnormality remains unclear. Proteins of the intraflagellar transport (IFT) machinery are linked to cystogenesis and are required for cilia formation in non-cycling cells. Several IFT proteins also localize to spindle poles in mitosis, indicating uncharacterized functions for these proteins in dividing cells. Here, we show that IFT88 depletion induces mitotic defects in human cultured cells, in kidney cells from the IFT88 mouse mutant Tg737(orpk) and in zebrafish embryos. In mitosis, IFT88 is part of a dynein1-driven complex that transports peripheral microtubule clusters containing microtubule-nucleating proteins to spindle poles to ensure proper formation of astral microtubule arrays and thus proper spindle orientation. This work identifies a mitotic mechanism for a cilia protein in the orientation of cell division and has important implications for the etiology of ciliopathies.
© 2011 Macmillan Publishers Limited. All rights reserved
Figures
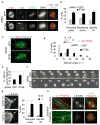
Figure 1. IFT88 depletion leads to mitotic defects in HeLa cells, kidney cells from the Tg737orpk mouse mutant and zebrafish
(a) Immunofluorescence images of control (GFP) and IFT88 siRNA-treated mitotic HeLa cells. αtubulin (α tub, MTs) and γtubulin (γ tub, spindle poles, arrow) staining show spindle pole defects. CREST (kinetochores) or DAPI (DNA) staining show misaligned chromosomes. Scale bars, 5μm. (b) Quantification of mitotic defects following IFT88 or control (GFP) siRNA treatment in HeLa cells. Defects include disrupted poles (α and γtubulin), misaligned chromosomes (DAPI staining) and spindle misorientation (spindle tilt, spindle poles in different focal planes). n=70 mitotic cells/experiment. (c–d) Side views of three-dimensional reconstructed immunofluoresence images (c) show misoriented mitotic spindles in IFT88 versus control siRNA-treated HeLa cells. Spindle (EB1), centrosomes (5051) and DNA (Phos-H3). Histogram (d) shows metaphase spindle angle distribution in control and IFT88 siRNA-treated cells. n=30 mitotic spindles. Schematic (d, top) shows spindle angle (α) measurement. H, hypotenuse. O, opposite. (e–f) Quantification (e) and time-lapse images (f) show uneven timing of daughter cell flattening onto the substrate after mitosis (misoriented cell division) in IFT88 siRNA treated HeLa cells compared to control. n=50 mitotic cells/experiment. Arrows, time when the first daughter cell begins flattening. Time, min. Scale bar, 10um. (g) Immunofluorescence images showing a disrupted spindle pole (αtubulin, arrow) in kidney cells derived from the IFT88 mouse mutant Tg737orpk (Tg737−/−) compared to wt (Tg737+/+). Scale bars, 2μm. Graph (right): quantification of mitotic defects in wt and Tg737orpk mutant cells. (h) Immunofluorescence images of mitotic spindles from the pronephric ducts of whole mount zebrafish embryos. Control embryo, cell with aligned chromosomes and mitotic spindle oriented in the longitudinal plane of the duct. IFT88 depleted embryo, cell with nonaligned chromosomes and misoriented spindle. Lines, pronephric duct border. Dotted lines, spindle orientation. MO, morpholino. Right, enlargements of boxed spindles. Scale bar, 5 μm.
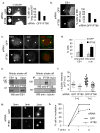
Figure 2. IFT88 depletion disrupts astral MTs and the spindle pole localization of proteins involved in MT nucleation in HeLa cells
(a) Immunofluoresence images of mitotic spindles showing disrupted astral MTs (αtubulin) at spindle poles of IFT88 depleted cells compared to control. Pixel intensity range increased to visualize astral MTs (arrow). Enlargements, spindle pole region. Graph (right), quantification of cells with long astral MTs (>3μm). n=70 mitotic spindles/experiment. (b) Side view of three-dimensional reconstructed images showing astral MTs (EB1 staining) contacting the cortex in control cells (arrow, upper panel) and astral MTs which fail to contact the cell cortex in IFT88 depleted cells (arrow, lower panel). Dotted lines, cell cortex. Graph (right): quantification of cells with both poles showing astral MTs contacting cortex. n=50 mitotic spindles/experiment. (c, d) Immunofluorescence images (c) and quantification (d) of mitotic spindles showing loss of EB1 and γtubulin (γ tub) from spindle poles (arrow) in IFT88 depleted cells compared to control. Graph (d): % cells with disrupted pole localization of EB1 or γtubulin (γ tub). n=50 mitotic spindles/experiment. Scale bar, 5μm. (e) Immunoblots showing that IFT88 co-immunoprecipitates with EB1 (left) and that γtubulin co-immunoprecipitates with IFT88 (right) from lysates of mitotic HeLa cells demonstrating a mitotic interaction between the proteins, either direct or indirect. Ig, rabbit antibody, negative IP control. Input, 5% of total lysate used for IP. For full scan of immunoblots see Supplementary Fig. S8. (f) Quantification of γtubulin intensity at spindle poles of mitotic cells showing γtubulin recruitment to poles in a MT regrowth experiment. T, time after nocodazole washout (min). Bar, median. Experiment shown is representative of three independent experiments. a.u., arbitrary unit. (g) Immunofluoresence images showing MT regrowth (αtubulin) at mitotic spindle poles 0min, 1min and 2min after nocodazole washout in IFT88 or GFP depleted mitotic cells. T=0min shows no nucleation in GFP and IFT88 depleted cells, T=1min and 2min show decreased nucleation in IFT88 depleted cells compared to control cells. Scale bar, 2μm. (h) % cells showing detectable nucleation (aster size ≥ 1μm) 0min, 1min and 2min after nocodazole washout. n=50 mitotic cells/experiment; error bars, mean of at least 3 experiments +/− SD.
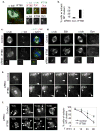
Figure 3. IFT88 is required for the movement of peripheral MT clusters containing MT nucleating components toward spindle poles in LLC-PK1 cells stably expressing GFP-α tubulin
(a) Immunofluoresence images showing IFT88 and dynein (intermediate chain, dynein IC) localizing to a peripheral MT cluster (GFP-αtubulin) in a prometaphase cell. Pixel intensity range increased to visualize peripheral MT cluster. Scale bar, 5μm. Inset, peripheral MT cluster. See Supplementary information Fig. S4a for negative controls. (b) Quantification of GFP-αtubulin LLC-PK1 metaphase cells with ectopic MT clusters following IFT88 or control (Con, lamin) siRNA treatment. n=50 mitotic cells/experiment. (c–d) Immunofluoresence images of GFP-αtubulin LLC-PK1 control or IFT88 depleted metaphase cells. γtubulin (c), EB1 (d, left) and dynein (d, right) localize to ectopic MT clusters. Insets, ectopic MT clusters. Scale bar, 5μm. (e) Selected still images from time-lapse movies of GFP-αtubulin LLC-PK1 cells. Control prometaphase, minus-end directed motion of peripheral MT clusters toward spindle pole. In IFT88 depleted cells, peripheral clusters formed but showed no movement towards spindle poles. Full cell (left); enlargement of spindle pole and MT cluster (right). Time (min); arrowhead, MT cluster; arrow, spindle pole. (f) Immunofluorescence images (left) and quantification (right) of the relocalization of MT clusters to spindle poles in a spindle reassembly assay (αtubulin, MT regrowth following nocodazole washout). The decrease in cells with ectopic MT clusters over time correlates with their movement towards the poles. IFT88 depletion delays relocalization of MT clusters to poles. Arrows, spindle poles (localization confirmed with centrosome protein staining). Arrowheads, ectopic MT clusters. n=40 mitotic cells/experiment/time point. T, time after nocodazole washout (min).
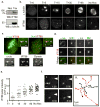
Figure 4. IFT88 moves towards spindle poles and requires MTs for its spindle pole localization
(a) MT pull down assay shows IFT88 co-pelleted with taxol-stabilized MTs (Tax) in mitotic HeLa cell lysates. Nocodazole (Noc), inhibition of microtubule polymerization used as negative control. αtubulin, MTs (b) Immunofluoresence images showing IFT88 foci formation (lower panel) after nocodazole washout (αtubulin, MT regrowth; upper panel) in HeLa cells. T, time after nocodazole washout (min). Control without nocodazole (no noc). Scale bar, 5μm. (c, d) Immunofluorescence images showing the molecular composition of IFT88 foci in HeLa cells. Maximum projection of a cell with IFT88 foci 5min after nocodazole washout (c) shows that IFT88 foci co-stain for αtubulin and dynein intermediate chain (Dyn). Enlargments, single plane of the boxed foci. Enlargements of IFT88 foci (d) showing that MT clusters can be observed extending from the foci, and that IFT88 foci costain with MT nucleating components (5051, centrosome protein marker; γtubulin; EB1). Pixel intensity range increased to visualize foci. Scale bar, 1μm. (e) Quantification of IFT88 intensity at spindle poles of mitotic HeLa cells showing IFT88 recruitment to poles following nocodazole washout. T, time after nocodoazole washout (min). Experiment shown is representative of three independent experiments. Bar, median. a.u., arbitrary unit. No nocodazole (No Noc), untreated cells. (f) Still images from time-lapse imaging of a GFP-IFT88 LLC-PK1 cell line (I.) showing one of the GFP-IFT88 foci (arrowhead) moving toward the GFP-IFT88-labeled spindle pole (arrow). Time elapsed is shown in seconds. Scale bar, 1μm. Schematic representation (II.) of several GFP-IFT88 foci moving toward (red arrow) or away from (black arrowhead) the spindle pole (grey dot). Time between points, 1second. Arrows indicate the direction of the movement.
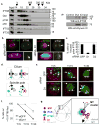
Figure 5. IFT88 is part of a dynein1-driven transport complex in mitosis
(a) Immunoblots (left) showing fractions of mitotic HeLa cell lysates obtained after gel filtration fractionation and probed for IFT88, dynein intermediate chain, dynactin p150/glued, p50 dynactin, IFT52 and IFT20. Input, total lysate before gel filtration. Arrowheads, peak elution fraction for calibration proteins: BSA (66kDa), β-amylase (200kDa), thyroglobulin (669kDa). V, Void volume. Immunoprecipitation experiment (right) performed on fractions 16 to 22 from gel filtration containing dynein. Immunoblots show that IFT88 co-immunoprecipitates with dynein (IC, intermediate chain) after gel filtration. For full scan of immunoblots see Supplementary Fig. S8. (b–d) Immunofluorescence images of HeLa cells (b) showing IFT88 redistribution from mitotic spindle poles to a more diffuse region surrounding the poles following dynein1 (D1) depletion compared to control (GFP). αtubulin (α tub). Intensity profiles, lower left panels; Spindle pole enlargement, lower right panels. Scale bar, 5μm. Graph (c), % cells with focused IFT88 localization at poles following dynein1 (D1) or dynein2 (D2) siRNA treatment. n=70 mitotic spindles/experiment. Schematic representation (d) of IFT88 (green) redistribution in cilia when D2 is depleted, and around mitotic spindle poles when D1 is depleted. (e, f) Immunofluorescence images (e) showing that D1 depletion in HeLa cells delays IFT88 (red) relocalization to spindle poles in a spindle reassembly assay (αtubulin, green). The decrease of cytoplasmic foci over time, observed in control (GFP) cells correlates with the relocalization of IFT88 from foci to spindle poles. Despite the formation of MT clusters in D1 depleted cells, several IFT88 foci remain in the cytoplasm 30 min after nocodazole washout. Arrows, spindle poles; Arrowheads, IFT88 foci. Graph (f): % of cells with more than ten cytoplasmic foci. n=40 cells/experiment/time point. T, time after nocodazole washout (min). (g) Molecular model for IFT88 function in mitosis. IFT88 is depicted as a component of a minus-end directed dynein1-driven transport complex. This complex is required for transport of MT clusters and their associated nucleating components (EB1 and γtubulin) to spindle poles. IFT88 thus contributes to the formation of astral MT arrays and consequently spindle orientation. Adapted from.
Similar articles
- Msd1/SSX2IP-dependent microtubule anchorage ensures spindle orientation and primary cilia formation.
Hori A, Ikebe C, Tada M, Toda T. Hori A, et al. EMBO Rep. 2014 Feb;15(2):175-84. doi: 10.1002/embr.201337929. Epub 2014 Jan 7. EMBO Rep. 2014. PMID: 24397932 Free PMC article. - CSAP localizes to polyglutamylated microtubules and promotes proper cilia function and zebrafish development.
Backer CB, Gutzman JH, Pearson CG, Cheeseman IM. Backer CB, et al. Mol Biol Cell. 2012 Jun;23(11):2122-30. doi: 10.1091/mbc.E11-11-0931. Epub 2012 Apr 4. Mol Biol Cell. 2012. PMID: 22493317 Free PMC article. - IFT proteins spatially control the geometry of cleavage furrow ingression and lumen positioning.
Taulet N, Vitre B, Anguille C, Douanier A, Rocancourt M, Taschner M, Lorentzen E, Echard A, Delaval B. Taulet N, et al. Nat Commun. 2017 Dec 4;8(1):1928. doi: 10.1038/s41467-017-01479-3. Nat Commun. 2017. PMID: 29203870 Free PMC article. - New frontiers: discovering cilia-independent functions of cilia proteins.
Vertii A, Bright A, Delaval B, Hehnly H, Doxsey S. Vertii A, et al. EMBO Rep. 2015 Oct;16(10):1275-87. doi: 10.15252/embr.201540632. Epub 2015 Sep 9. EMBO Rep. 2015. PMID: 26358956 Free PMC article. Review. - The Oak Ridge Polycystic Kidney mouse: modeling ciliopathies of mice and men.
Lehman JM, Michaud EJ, Schoeb TR, Aydin-Son Y, Miller M, Yoder BK. Lehman JM, et al. Dev Dyn. 2008 Aug;237(8):1960-71. doi: 10.1002/dvdy.21515. Dev Dyn. 2008. PMID: 18366137 Free PMC article. Review.
Cited by
- Biallelic mutations of TTC12 and TTC21B were identified in Chinese patients with multisystem ciliopathy syndromes.
Chen W, Wang F, Zeng W, Zhang X, Shen L, Zhang Y, Zhou X. Chen W, et al. Hum Genomics. 2022 Oct 22;16(1):48. doi: 10.1186/s40246-022-00421-z. Hum Genomics. 2022. PMID: 36273201 Free PMC article. - Architecture and function of IFT complex proteins in ciliogenesis.
Taschner M, Bhogaraju S, Lorentzen E. Taschner M, et al. Differentiation. 2012 Feb;83(2):S12-22. doi: 10.1016/j.diff.2011.11.001. Epub 2011 Nov 25. Differentiation. 2012. PMID: 22118932 Free PMC article. Review. - Hemodynamic Forces Regulate Cardiac Regeneration-Responsive Enhancer Activity during Ventricle Regeneration.
Geng F, Ma J, Li X, Hu Z, Zhang R. Geng F, et al. Int J Mol Sci. 2021 Apr 11;22(8):3945. doi: 10.3390/ijms22083945. Int J Mol Sci. 2021. PMID: 33920448 Free PMC article. - Epigenetic reprogramming shapes the cellular landscape of schwannoma.
Liu SJ, Casey-Clyde T, Cho NW, Swinderman J, Pekmezci M, Dougherty MC, Foster K, Chen WC, Villanueva-Meyer JE, Swaney DL, Vasudevan HN, Choudhury A, Pak J, Breshears JD, Lang UE, Eaton CD, Hiam-Galvez KJ, Stevenson E, Chen KH, Lien BV, Wu D, Braunstein SE, Sneed PK, Magill ST, Lim D, McDermott MW, Berger MS, Perry A, Krogan NJ, Hansen MR, Spitzer MH, Gilbert L, Theodosopoulos PV, Raleigh DR. Liu SJ, et al. Nat Commun. 2024 Jan 12;15(1):476. doi: 10.1038/s41467-023-40408-5. Nat Commun. 2024. PMID: 38216587 Free PMC article. - Cilia, Wnt signaling, and the cytoskeleton.
May-Simera HL, Kelley MW. May-Simera HL, et al. Cilia. 2012 May 2;1(1):7. doi: 10.1186/2046-2530-1-7. Cilia. 2012. PMID: 23351924 Free PMC article.
References
- Hildebrandt F, Otto E. Cilia and centrosomes: a unifying pathogenic concept for cystic kidney disease? Nat Rev Genet. 2005;6:928–940. - PubMed
- Fischer E, et al. Defective planar cell polarity in polycystic kidney disease. Nat Genet. 2006;38:21–23. - PubMed
- Sun Z, et al. A genetic screen in zebrafish identifies cilia genes as a principal cause of cystic kidney. Development. 2004;131:4085–4093. - PubMed
Publication types
MeSH terms
Substances
Grants and funding
- R56 GM051994/GM/NIGMS NIH HHS/United States
- R56 GM051994-14/GM/NIGMS NIH HHS/United States
- P30 DK032520/DK/NIDDK NIH HHS/United States
- GM51994/GM/NIGMS NIH HHS/United States
- DK32520/DK/NIDDK NIH HHS/United States
- R01 GM051994/GM/NIGMS NIH HHS/United States
LinkOut - more resources
Full Text Sources
Other Literature Sources
Molecular Biology Databases
