Histone deacetylase 6 and heat shock protein 90 control the functions of Foxp3(+) T-regulatory cells - PubMed (original) (raw)
Histone deacetylase 6 and heat shock protein 90 control the functions of Foxp3(+) T-regulatory cells
Edwin F de Zoeten et al. Mol Cell Biol. 2011 May.
Abstract
Foxp3(+) T-regulatory cells (Tregs) are key to immune homeostasis such that their diminished numbers or function can cause autoimmunity and allograft rejection. Foxp3(+) Tregs express multiple histone/protein deacetylases (HDACs) that regulate chromatin remodeling, gene expression, and protein function. Pan-HDAC inhibitors developed for oncologic applications enhance Treg production and Treg suppression function but have limited nononcologic utility given their broad actions and various side effects. We show, using HDAC6-deficient mice and wild-type (WT) mice treated with HDAC6-specific inhibitors, that HDAC6 inhibition promotes Treg suppressive activity in models of inflammation and autoimmunity, including multiple forms of experimental colitis and fully major histocompatibility complex (MHC)-incompatible cardiac allograft rejection. Many of the beneficial effects of HDAC6 targeting are also achieved by inhibition of the HDAC6-regulated protein heat shock protein 90 (HSP90). Hence, selective targeting of a single HDAC isoform, HDAC6, or its downstream target, HSP90, can promote Treg-dependent suppression of autoimmunity and transplant rejection.
Figures
Fig. 1.
HDAC6 deletion enhances Treg suppression. (a) No major differences were seen in proportions of CD4, CD8, or CD4+ Foxp3+ cells in thymi, spleens, or pooled lymph nodes of HDAC6−/− versus WT mice; flow cytometry data representative of 4 mice/group. (b) qPCR analysis of HDAC6 expression in naïve or activated CD4+ CD25− T cells (Tcon) and CD4+ CD25+ (Treg) cells isolated from WT mice; cells were activated with CD3/CD28 MAbs (1 μg/ml). Data (means ± standard deviations, n = 6/group) are expressed as fold increases over levels in naïve Tcon cells (normalized to 18S rRNA); significant differences between corresponding naïve and activated cells are shown (*, P < 0.05; **, P < 0.01). (c) qPCR analysis of Treg genes in naïve WT versus HDAC6−/− Tregs versus Tcon cells; data (means ± standard deviations, n = 6/group) are expressed as fold increases over levels in naïve CD4+ CD25− cells (normalized to 18S rRNA); significant differences between Tregs are shown (*, P < 0.05; **, P < 0.01). (d) HDAC6−/− Tregs cells express ∼1.5-fold more Foxp3 as determined by Western blot analysis of Tregs and Tcon cells (5 × 10⁶) isolated from the spleen and lymph nodes using magnetic beads. (e) Flow cytometric analysis (means ± standard deviations, n = 3/group) of phenotypic markers characteristic of effector/memory Tregs in thymi (Thy), spleens (Spl), or lymph nodes (LN); *, P < 0.05; **, P < 0.01. (f) HDAC6−/− Tregs have increased suppressive capability compared to WT Tregs as shown using in vitro assays. Tregs from each group were added to CFSE-labeled Tcon cells that were activated for 72 h with CD3 MAb and irradiated APC; the percentage of proliferating T cells is shown in each plot; data are representative of 6 experiments. FITC, fluorescein isothiocyanate.
Fig. 2.
HDAC6i therapy enhances Treg suppression. (a) Increased acetylation of α-tubulin and increased expression of Foxp3 in Western blots of CD4+ CD25+ Tregs treated overnight with tubacin (0.1 μM) or TsA (1 ng/ml) versus control cells treated with niltubacin (0.1 μM). (b) qPCR analysis of gene expression in Tregs isolated from WT mice and treated overnight with tubacin or niltubacin (0.1 μM) or medium alone, plus activating CD3/CD28 MAbs (1 μg/ml); data (means ± standard deviations) are expressed as fold increases over levels in untreated WT Tregs (normalized to 18S rRNA); *, P < 0.01 for tubacin-treated Tregs versus niltubacin or medium alone. (c) Tubacin (0.1 μM) promotes the function of WT Tregs as shown by addition to standard in vitro Treg suppression assays (detailed in Fig. 1f). (d) Experiment similar to that shown in panel c except for use of tubastatin A (100 ng/ml). (e and f) Same conditions as those in panel d but with use of HDAC6−/− CFSE+ Tcon cells (e) or HDAC6−/− Tregs (f) so as to further limit the potential cellular target of added HDAC6i. Data for Treg suppression assays (c to f) are representative of at least 4 experiments.
Fig. 3.
Negligible effects of HDAC6i targeting on CD45RBhi T cell migration and proliferation post-adoptive transfer. Rag1−/− mice received naïve WT CD45RBhi CD4+ CD25− cells (1 × 10⁶) by i.p. injection and were treated daily with tubacin or niltubacin (0.5 mg/kg/day, i.p.) for 7 days (a) or WT or HDAC6−/− CD45RBhi CD4+ CD25− cells (1 × 10⁶) (b). Spleens, peripheral lymph nodes (PLN), and mesenteric lymph nodes (MLN) were analyzed by flow cytometry at 7 and 14 days for CD4+ cells and CD4+ Foxp3+ cells; the percentage of indicated cells is shown in each plot; data are representative of 4 experiments.
Fig. 4.
HDAC6 targeting increases Treg expression of HSF1-regulated genes. (a) qPCR analysis of HSP90aa1 and HSP90ab1 expression in naïve Tcon cells and Tregs of WT and HDAC6−/− B6 mice; data (means ± standard deviations, n = 6/group) are expressed as fold increases over levels in naïve Tcon cells (normalized to 18S rRNA); *, P < 0.01 for HDAC6−/− versus respective WT cells. (b) Flow cytometry showed increased expression of HSP90 in Tregs versus Tcon cells. (c and d) Western blot analyses showed a marked increase in acetylation of HSP90 in HDAC6−/− Tregs versus WT controls. Lysates of cells isolated using magnetic beads were separated by 10% SDS-PAGE, and blots were probed using Abs to HSP90 and acetylated K69-HSP90 (c) and acetylated K294-HSP90 (d); HSC70 was used as a loading control, and results are representative of 3 experiments. (e and f) Microarray analysis of Tregs isolated from HDAC6−/− and WT mice using the Affymetrix Mouse430a chip. Array data were subjected to robust multiarray average (RMA) normalization and z-score transformation for display and analyzed using Mayday (version 2.10) (5). (e) Genes known to be upregulated by transactivated HSF1 after its release from acetylated HSP90 are shown at left, and additional genes downregulated by HSF1 are shown at right. (f) Genes known to be important to Treg function and upregulated HDAC6−/− Tregs are shown at left, and genes downregulated in HDAC6−/− Tregs are shown at right. (g) qPCR analysis of both inducible HSP70 genes, HSPA1a and HSPA1b, that require HSF1 binding for expression; data (means ± standard deviations, n = 6/group) are expressed as fold increases over levels in naïve Tcon cells (normalized to 18S rRNA) (*, P < 0.01 for CD4+ CD25+ HDAC6−/− Tregs versus all other groups).
Fig. 5.
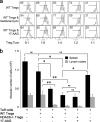
Nonadditive effects of joint targeting of HDAC6 and HSP90. (a) In vitro suppression assays comparing effects of treatment of WT Tregs with the HSP90i geldanamycin (3.6 nM) or 17-AAG (0.1 μM); the percentage of dividing CFSE+ Tcon cells in each well is shown at top left, and data are representative of 3 separate experiments. FITC, fluorescein isothiocyanate. (b) Comparable efficacies of HDAC6−/− Tregs and HSP90i therapy in inhibiting homeostatic T cell proliferation. Rag−/− C57BL/6 mice (3/group) were injected intravenously with 1 × 10⁶ Thy1.1+ Tcon cells and 2.5 × 10⁵ cells of either WT or HDAC6−/− Thy1.2+ Tregs. The indicated groups of mice were treated daily with 17-AAG (40 mg/kg) or control DMSO for 7 days. Thereafter, spleens and lymph nodes were collected, single-cell suspensions were prepared, and live Thy1.1+ cells were determined by flow cytometry; total numbers of homeostatic proliferating cells were expressed as absolute numbers of cells × 106. Data are representative of 3 experiments. *, P < 0.05; **, P < 0.01; ns, not significant.
Fig. 6.
Efficacy of tubacin (HDAC6i) in both prevention and therapy of colitis. (a) Mice receiving DSS plus tubacin or niltubacin (0.5 mg/kg/day) were monitored for weight loss; tubacin-treated mice lost less weight than did niltubacin-treated mice (P < 0.025). (b) Beneficial effects of tubacin therapy in preventing DSS colitis were abrogated by Treg depletion (thymectomy and CD25 MAb) (_P_ > 0.05 versus niltubacin). (c) Rag1−/− mice adoptively transferred with 1 × 10⁶ C57BL/6 CD4+ CD45RBhi cells developed clinical evidence of colitis and >20% weight loss by ∼55 days posttransfer; in contrast to the use of niltubacin, mice treated with tubacin (0.5 mg/kg/day) showed clinical improvement (P < 0.005). (d) Hematoxylin and eosin-stained colonic sections (original magnifications, ×125) from mice shown in panel c at 28 days after initiation of HDAC6i therapy. All studies involved 8 to 10 mice/group, and data are representative of 3 experiments.
Fig. 7.
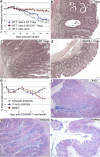
Effects of HDAC6 and HSP90 targeting on T cell-dependent colitis. (a) B6/Rag1−/− mice (n = 8/group) were adoptively transferred with 1 × 10⁶ WT CD4+ CD45RBhi cells and 1.25 × 10⁵ CD4+ CD25+ cells from naïve WT mice (blue diamonds), HDAC6−/− mice (red squares), or control naïve Tcon cells (green triangles); for data from 60 days onwards, P was <0.05 for WT Tregs versus Tcon cells and P was <0.007 for HDAC6−/− versus WT Tregs. (b to d) Hematoxylin and eosin-stained sections of colons (original magnifications, ×125) harvested at 60 days post-cell transfer of 1 × 10⁶ WT B6 CD4+ CD45RBhi cells and no Tregs (b), WT Tregs (c), or HDAC6−/− Tregs (d). (e) B6/Rag1−/− mice (n = 8/group) adoptively transferred with 1 × 10⁶ WT CD4+ CD45RBhi cells and after 30 days treated daily for 14 days with tubastatin A (25 mg/kg), 17-AAG (40 mg/kg), or DMSO alone; data are presented as weight loss (mean ± standard deviation), and P is <0.01 from 50 days onwards for HDAC6i or HSP90i versus DMSO. (f to h) Alcian Blue-stained sections of colonic samples from groups of mice shown in panel e, including those receiving DMSO alone (f), tubastatin A (g), or 17-AAG (h); note the loss of blue goblet cells and the significant mononuclear infiltrate in the DMSO-treated colon (representative of 3 mice/group).
Fig. 8.
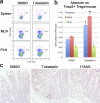
HDAC6i treatment increased Treg numbers in colitic mice. (a) Flow cytometric evaluation of CD4+ Foxp3+ cells in Rag1−/− mice (n = 4/group) adoptively transferred with WT CD4+ CD45RBhi cells (1 × 10⁶) and 30 days later injected daily i.p. with either tubastatin A (25 mg/kg) or DMSO control for 14 days. Mice were then euthanized, and tissues were harvested for flow cytometry. (b) Absolute numbers of Foxp3+ cells isolated from the mice shown in panel a; compared to use of DMSO alone, tubastatin A increased Treg numbers in the spleen (*, P < 0.01) and mesenteric lymph nodes (MLN) (**, _P_ < 0.005), whereas the numbers of Tregs in peripheral lymph nodes (PLN) were unchanged (_P_ > 0.05). (c) Immunoperoxidase staining of representative samples of n = 4/group showing, compared to DMSO-treated mice, increased Foxp3+ Treg infiltration of colons from mice receiving CD45RBhi cells and therapy for 14 days with either HDAC6i (tubastatin A) or HSP90i (17-AAG) once colitis had developed. (Paraffin sections, blue hematoxylin counterstain; diaminobenzidine-positive cells in brown; original magnifications, ×300.)
Fig. 9.
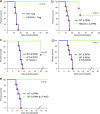
Effects of HDAC6 and HSP90 targeting on T cell-dependent allograft rejection. Kaplan-Meier plots of fully MHC-disparate cardiac allograft survival in B6/Rag1−/− mice adoptively transferred with WT T cells (1 × 10⁶) and 0.25 ×10⁶ WT or HDAC6−/− Tregs (a); WT or HDAC6−/− mice treated for 14 days with low-dose RPM (0.1 mg/kg/day, 14 days) (b); or WT mice treated daily for 14 days with low-dose RPM plus tubacin (1.2 mg/kg) (c), tubastatin A (40 mg/kg) (d), or 17-AAG (40 mg/kg) (e). Data in each panel are from 4 or 5 allografts/group and are representative of 2 separate sets of experiments in each case.
Similar articles
- Histone deacetylases 6 and 9 and sirtuin-1 control Foxp3+ regulatory T cell function through shared and isoform-specific mechanisms.
Beier UH, Wang L, Han R, Akimova T, Liu Y, Hancock WW. Beier UH, et al. Sci Signal. 2012 Jun 19;5(229):ra45. doi: 10.1126/scisignal.2002873. Sci Signal. 2012. PMID: 22715468 Free PMC article. - Histone/protein deacetylase 11 targeting promotes Foxp3+ Treg function.
Huang J, Wang L, Dahiya S, Beier UH, Han R, Samanta A, Bergman J, Sotomayor EM, Seto E, Kozikowski AP, Hancock WW. Huang J, et al. Sci Rep. 2017 Aug 17;7(1):8626. doi: 10.1038/s41598-017-09211-3. Sci Rep. 2017. PMID: 28819166 Free PMC article. - Inhibition of HDAC9 increases T regulatory cell function and prevents colitis in mice.
de Zoeten EF, Wang L, Sai H, Dillmann WH, Hancock WW. de Zoeten EF, et al. Gastroenterology. 2010 Feb;138(2):583-94. doi: 10.1053/j.gastro.2009.10.037. Epub 2009 Oct 29. Gastroenterology. 2010. PMID: 19879272 Free PMC article. - Histone/protein deacetylases control Foxp3 expression and the heat shock response of T-regulatory cells.
Beier UH, Akimova T, Liu Y, Wang L, Hancock WW. Beier UH, et al. Curr Opin Immunol. 2011 Oct;23(5):670-8. doi: 10.1016/j.coi.2011.07.002. Epub 2011 Jul 26. Curr Opin Immunol. 2011. PMID: 21798734 Free PMC article. Review. - Histone/protein deacetylase inhibitor therapy for enhancement of Foxp3+ T-regulatory cell function posttransplantation.
Wang L, Beier UH, Akimova T, Dahiya S, Han R, Samanta A, Levine MH, Hancock WW. Wang L, et al. Am J Transplant. 2018 Jul;18(7):1596-1603. doi: 10.1111/ajt.14749. Epub 2018 Apr 21. Am J Transplant. 2018. PMID: 29603600 Free PMC article. Review.
Cited by
- Inhibition of N-terminal ATPase on HSP90 attenuates colitis through enhanced Treg function.
Collins CB, Aherne CM, Yeckes A, Pound K, Eltzschig HK, Jedlicka P, de Zoeten EF. Collins CB, et al. Mucosal Immunol. 2013 Sep;6(5):960-71. doi: 10.1038/mi.2012.134. Epub 2013 Jan 16. Mucosal Immunol. 2013. PMID: 23321985 Free PMC article. - Editorial: HDAC inhibition begets more MDSCs.
Reddy P. Reddy P. J Leukoc Biol. 2012 May;91(5):679-81. doi: 10.1189/jlb.1111541. J Leukoc Biol. 2012. PMID: 22547132 Free PMC article. - M-134, a novel HDAC6-selective inhibitor, markedly improved arthritic severity in a rodent model of rheumatoid arthritis when combined with tofacitinib.
Bae D, Choi Y, Lee J, Ha N, Suh D, Baek J, Park J, Son W. Bae D, et al. Pharmacol Rep. 2021 Feb;73(1):185-201. doi: 10.1007/s43440-020-00188-x. Epub 2020 Nov 13. Pharmacol Rep. 2021. PMID: 33188511 - Therapeutic effect of a novel histone deacetylase 6 inhibitor, CKD-L, on collagen-induced arthritis in vivo and regulatory T cells in rheumatoid arthritis in vitro.
Oh BR, Suh DH, Bae D, Ha N, Choi YI, Yoo HJ, Park JK, Lee EY, Lee EB, Song YW. Oh BR, et al. Arthritis Res Ther. 2017 Jul 3;19(1):154. doi: 10.1186/s13075-017-1357-2. Arthritis Res Ther. 2017. PMID: 28673326 Free PMC article. - T cells lacking HDAC11 have increased effector functions and mediate enhanced alloreactivity in a murine model.
Woods DM, Woan KV, Cheng F, Sodré AL, Wang D, Wu Y, Wang Z, Chen J, Powers J, Pinilla-Ibarz J, Yu Y, Zhang Y, Wu X, Zheng X, Weber J, Hancock WW, Seto E, Villagra A, Yu XZ, Sotomayor EM. Woods DM, et al. Blood. 2017 Jul 13;130(2):146-155. doi: 10.1182/blood-2016-08-731505. Epub 2017 May 26. Blood. 2017. PMID: 28550044 Free PMC article.
References
- Bali P., et al. 2005. Inhibition of histone deacetylase 6 acetylates and disrupts the chaperone function of heat shock protein 90: a novel basis for antileukemia activity of histone deacetylase inhibitors. J. Biol. Chem. 280:26729–26734 - PubMed
- Barnes P. J. 2009. Role of HDAC2 in the pathophysiology of COPD. Annu. Rev. Physiol. 71:451–464 - PubMed
Publication types
MeSH terms
Substances
Grants and funding
- K08 DK080189/DK/NIDDK NIH HHS/United States
- P01AI073489/AI/NIAID NIH HHS/United States
- K08DK080189/DK/NIDDK NIH HHS/United States
- K08 CA128972/CA/NCI NIH HHS/United States
- P01 AI073489/AI/NIAID NIH HHS/United States
- K08 AI095353/AI/NIAID NIH HHS/United States
LinkOut - more resources
Full Text Sources
Other Literature Sources
Molecular Biology Databases
Research Materials


