A high precision survey of the molecular dynamics of mammalian clathrin-mediated endocytosis - PubMed (original) (raw)
A high precision survey of the molecular dynamics of mammalian clathrin-mediated endocytosis
Marcus J Taylor et al. PLoS Biol. 2011 Mar.
Abstract
Dual colour total internal reflection fluorescence microscopy is a powerful tool for decoding the molecular dynamics of clathrin-mediated endocytosis (CME). Typically, the recruitment of a fluorescent protein-tagged endocytic protein was referenced to the disappearance of spot-like clathrin-coated structure (CCS), but the precision of spot-like CCS disappearance as a marker for canonical CME remained unknown. Here we have used an imaging assay based on total internal reflection fluorescence microscopy to detect scission events with a resolution of ∼ 2 s. We found that scission events engulfed comparable amounts of transferrin receptor cargo at CCSs of different sizes and CCS did not always disappear following scission. We measured the recruitment dynamics of 34 types of endocytic protein to scission events: Abp1, ACK1, amphiphysin1, APPL1, Arp3, BIN1, CALM, CIP4, clathrin light chain (Clc), cofilin, coronin1B, cortactin, dynamin1/2, endophilin2, Eps15, Eps8, epsin2, FBP17, FCHo1/2, GAK, Hip1R, lifeAct, mu2 subunit of the AP2 complex, myosin1E, myosin6, NECAP, N-WASP, OCRL1, Rab5, SNX9, synaptojanin2β1, and syndapin2. For each protein we aligned ∼ 1,000 recruitment profiles to their respective scission events and constructed characteristic "recruitment signatures" that were grouped, as for yeast, to reveal the modular organization of mammalian CME. A detailed analysis revealed the unanticipated recruitment dynamics of SNX9, FBP17, and CIP4 and showed that the same set of proteins was recruited, in the same order, to scission events at CCSs of different sizes and lifetimes. Collectively these data reveal the fine-grained temporal structure of CME and suggest a simplified canonical model of mammalian CME in which the same core mechanism of CME, involving actin, operates at CCSs of diverse sizes and lifetimes.
Conflict of interest statement
The authors have declared that no competing interests exist.
Figures
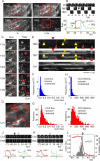
Figure 1. The characteristics of endocytically active CCSs.
(A) Images from a sequence of 400 images acquired in synchrony with alternating pH. Portion of an NIH-3T3 cell expressing Clc-mCherry (top panels) and TfR-phl (lower panels) imaged at pH 7.4 (Clc7, TfR7; left panels) at time t and at pH 5.5 (Clc5, TfR5; right panels) at time t+2 s. (B) Example scission event. A CCS (Clc spot, upper panel) colocalized with a patch of TfR-phl at pH 7.4 (TfR7, middle panel). The scission event manifested as the appearance of a spot of pH-insulated TfR-phl in images acquired at pH 5.5 (TfR5, middle panel). Bona fide scission events met thresholds for SNR (SNR >5) and post-scission slope (Δ_F_/Δ_t_ <0.1; see Materials and Methods for details). (C) Time-resolved images of region of interest in (A). Scission events (red circles) manifested as the appearance of pH-insulated TfR-phl spots at both punctate CCSs and larger, pleiomorphic CCSs. (D) Spatial map of scission events in region of interest from (A). Candidate scission events (red crosses) detected over a 10-min interval were plotted on the average Clc-mCherry image. Scission events tended to cluster at “hot spots”. (E) A kymograph of Clc7 and TfR7 objects graphically illustrates that Clc7 and TfR7 at CCSs co-varied over time. Scission events appeared as transient streaks in the TfR5 image series (arrowheads). Two types of scission events occurred: those associated with complete disappearance of the associated CCS (terminal events, red arrowheads) and those where the CCS persisted (non-terminal events, yellow arrowheads). (F–I) To explore the characteristics of scission-competent CCSs further, the segmented Clc7 objects were tracked and divided into scission-detected” and scission-undetected CCSs (see Materials and Methods). (F and G) Histograms of median normalised fluorescence of Clc-mCherry for scission-undetected CCSs (F) and scission-detected CCSs (G). (H and I) Histograms of lifetimes for scission-undetected CCSs (H) and scission-detected CCSs (I). (J–L) Comparison of CCS disappearance and scission events as fiducial markers for CME. (J) A CCS disappearance event (grey arrow) with an associated scission event (black arrow). (K) An example CCP disappearance (grey arrow) without an associated scission event. Of 197 disappearance events, 107 (54%) were associated with scission events, as predicted. (L) CCS disappearance (red line) versus the timing of scission (grey histogram) for 107 scission-detected CCS disappearance events (timing of scission relative to CCS disappearance: −7±22 s).
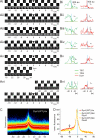
Figure 2. Dynamin was recruited at the time of CCV formation.
(A) Portion of a NIH-3T3 cell co-transfected with TfR-phl (left) and Dyn1-mCherry (Dyn1, centre), observed with TIR-FM at pH 7.4. Dynamin1 was colocalized with a subset of TfR-phl patches (yellow dots in the merged image, right). (B) An example scission event. At time 0, a CCV was detected in the image at pH 5 (black arrowhead). Dynamin1 was recruited transiently, with a peak at time −4 s. (C) Fluorescence measurements (dark green, TfR7; light green, TfR5; red, dynamin1) corresponding to the event displayed in (B). The dots correspond to the images shown. Vertical blue line shows time = 0 and horizontal lines show fluorescence = 0. (D) Average fluorescence for TfR7, TfR5, and dynamin1 for the events detected in the cell shown in (A) (n = 290). Black lines represent the median and 95% confidence limits for random fluorescence measurements (see Materials and Methods for calculation). (E) Data as in (C) pooled for eight cells (1,297 events). Averages of fluorescent traces of terminal (light blue) and non-terminal events (magenta) for TfR7, TfR5, and dynamin1. Note the overlap of curves before time = 0. (F) Histogram of peak dynamin1 recruitment for individual events. (G) Average dynamin1 (red, eight cells) and dynamin2 (purple, six cells) fluorescence curves normalised to the randomized measures. au, arbitrary units.
Figure 3. Individual Dyn1-mCherry recruitment events were variable, but the average Dyn1-mCherry recruitment signature was stable.
(A and B) Natural variation of Dyn1-mCherry recruitment to sites of scission. (Ai–Avi) Consecutive images of TfR7 (top), TfR5 (middle), and Dyn1-mCherry (bottom) movies centred on scission events detected in the TfR5 movies. The data are from the cell shown in Figure 2A. (Bi–Bvi) Quantification of fluorescence for TfR5 (light green curves), TfR7 (dark green curves), and Dyn1 (red curves) images for the corresponding events shown in (A). Vertical blue lines indicate t = 0 s, and black horizontal lines indicate zero fluorescence. Horizontal scale bar corresponds to 20 s, fluorescence values as indicated. Dots correspond to frames shown in (A). (C) The full set of Dyn1-mCherry fluorescence traces were normalised and overlaid as a cloud plot (see Materials and Methods). Red indicates higher data density, blue, lower density, and black, background. The average fluorescence recruitment trace is indicated by a white line. (D) Replicate Dyn1-mCherry recruitment signatures for either human (Hs) or mouse (Mm) Dyn1-mCherry. au, arbitrary units; WT, wild type.
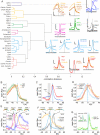
Figure 4. Modules of endocytic proteins.
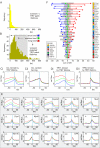
(A) Left, a list of proteins with significant recruitment to CCVs used in this study. The proteins were clustered according to the correlation distance between recruitment signatures shown at right. Clusters with distance below 0.2 are marked with a colour defining a protein module. The two Toca proteins, CIP4 and FBP17, fell outside of any cluster but were grouped together according to biological arguments (see text). Right, average recruitment signatures normalised to their randomized measures. Vertical black line shows time = 0. Horizontal black lines show median randomized measures, taken as fluorescence origin, and grey areas the 95% upper and lower confidence intervals. Scale bars = 20 s (horizontal) and 10×95% confidence interval (vertical). (B–F) Detailed view of recruitment traces of (B) TfR7, mu2 (AP2), and Clc; (C) Dyn1 and lifeAct; (D) N-WASP, lifeAct, Arp3, and cofilin; (E) endophilin, amphiphysin, SNX9, and APPL1; and (F) FCHo2, syndapin2, and FBP17. (G) GAK for terminal events (T), non-terminal events (NT) and scission events at spot-like CCSs that formed de novo (inset).
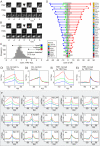
Figure 5. Scaling relationships between CCS size and recruitment signatures.
(A–E) Analysis of cells coexpressing Clc-mCherry and TfR-phl. (A) Example scission event at a punctate CCS. (B) Example scission event at a larger CCS. The larger (brighter) CCS was associated with a larger (brighter) patch of TfR-phl at pH 7.4. (C) Histogram of normalised TfR7 fluorescence (F TfR7), averaged over −18 to −10 s preceding scission. Size classes defined as indicated: blue = {F TfR7 <33rd percentile}; green = {33rd percentile < _F_ TfR7 <66th percentile}; red = {_F_ TfR7 >66th percentile}. (Di) Average normalised F Clc signatures for classes defined in (C). The signatures are well separated, indicating that F Clc scaled with F TfR7. (Dii) Average normalised Clc-mCherry fluorescence signatures (F Clc7) for randomly allocated classes. Note the signatures are very similar. (Ei) Average normalised F TfR7 signatures for classes defined in (C). The signatures are well separated, as expected. (Eii) Average normalised F TfR5 signatures for classes defined in (C). The signatures are very similar, indicating that TfR5 fluorescence did not scale strongly with CCS size. (F) Example traces showing the scaling relationship between F TfR7 and the respective RFP recruitment signatures. (G) Stem plot of sum of differences between class averages and the overall average ordered by magnitude, colour coding as in (B). Grey bars indicate the 95% confidence interval for random event assignment to classes.
Figure 6. Scaling relationships between CCS lifetime and recruitment signatures.
(A and B) Histograms of TfR7 patch lifetime (LTTfR7) for scission undetected (A) and scission detected (B) TfR7 patches in cells coexpressing Clc-mCherry and TfR-phl. (B) Time classes indicated in grey: blue = {LTTfR7 <120 s}; green = {120 s < LTTfR7 <480 s}; red = {LTTfR7 >480 s}. (Ci) Average, normalised F Clc traces for the three classes defined in (B). The F Clc7 class averages are well separated, indicating that F Clc7 scaled with LTTfR7. (Cii) Average, normalised F Clc traces for three randomly allocated classes. Note the F Clc7 traces are very similar. (Di) Average, normalised F TfR7 traces for the three classes defined in (B). The traces are well separated, indicating that F TfR7 scaled with LTTfR7. (Dii) Average, normalised F TfR5 traces for the three classes defined in (B). The traces are very similar, indicating that F TfR5 did not scale strongly with LTTfR7. (E) Example traces showing the scaling relationship between LTTfR7 and the respective RFP recruitment signatures. (F) Stem plot of sum of differences between class averages and the overall average ordered by magnitude, colour coding as in (B). Grey bars indicate the 95% confidence interval for random event assignment to classes.
Figure 7. The probability of detecting protein recruitment to sites of scission.
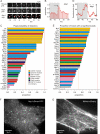
(A) A scission event (upper panel) defined a spot on the plasma membrane to which Abp1-mCherry (middle panel) was recruited. The recruited Abp1-mCherry was identified as an “object” in segmented images (lower panel). A region of interest (red circle) centred on the scission event (upper panel) was interrogated at each successive frame in the 80 s before and after scission to find whether a segmented object of more than three pixels and >8 s dwell time was present at the site of scission or not. Frames in which an object was detected were scored “1”, and “0” otherwise. The filtering thresholds were set using mCherry as a negative control, which scored a peak detection probability of 0.013, wherein residual detection of mCherry “objects” was due to detector noise. (B) The analysis was repeated for all events and the average scores calculated to yield a time-resolved profile representing the “probability of object detection” at a given frame relative to scission. (C) The analysis was repeated for all the tagged endocytic proteins, which were ranked by probability of detection and colour coded according to the module membership (as defined in Figure 4). (D) In the second analysis strategy, fluorescence traces, such as this example fluorescence trace for Abp1, were analysed to identify peaks (defined as biggest peak greater than six standard deviations of the last six F RFP values of the recording), and the proportion of scission events with a “significant peak” of recruitment was determined. (E) The analysis was repeated for all the tagged endocytic proteins analysed, which were subsequently ranked. (F and G) Example cells expressing Abp1-mCherry (F) or lifeAct-mCherry (G) illustrating the different patterns of fluorescence.
Figure 8. A simplified canonical model of mammalian CME.
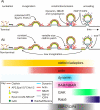
A simplified schematic illustrating the relative timing of recruitment of the seven different endocytic protein modules to sites of scission, highlighting some unexpected findings for future investigation. The patterns of recruitment are the same for terminal events (Ai) and non-terminal events (Aii). The heterogeneous size of endocytically productive CCSs is most easily explained if clathrin-coated buds formed at the edges of clathrin patches of variable size, thus accounting for the variability in fluorescence of endocytically active CCSs (Aii). Repeat scission events most likely occurred by re-growth of clathrin-coated invaginations at the edge of “host” patches of clathrin (lower curved arrow, [Aii]).
Similar articles
- Endocytic proteins are partitioned at the edge of the clathrin lattice in mammalian cells.
Sochacki KA, Dickey AM, Strub MP, Taraska JW. Sochacki KA, et al. Nat Cell Biol. 2017 Apr;19(4):352-361. doi: 10.1038/ncb3498. Epub 2017 Mar 27. Nat Cell Biol. 2017. PMID: 28346440 Free PMC article. - A feedback loop between dynamin and actin recruitment during clathrin-mediated endocytosis.
Taylor MJ, Lampe M, Merrifield CJ. Taylor MJ, et al. PLoS Biol. 2012;10(4):e1001302. doi: 10.1371/journal.pbio.1001302. Epub 2012 Apr 10. PLoS Biol. 2012. PMID: 22505844 Free PMC article. - The clathrin adaptor Dab2 recruits EH domain scaffold proteins to regulate integrin β1 endocytosis.
Teckchandani A, Mulkearns EE, Randolph TW, Toida N, Cooper JA. Teckchandani A, et al. Mol Biol Cell. 2012 Aug;23(15):2905-16. doi: 10.1091/mbc.E11-12-1007. Epub 2012 May 30. Mol Biol Cell. 2012. PMID: 22648170 Free PMC article. - Clathrin coated pits, plaques and adhesion.
Lampe M, Vassilopoulos S, Merrifield C. Lampe M, et al. J Struct Biol. 2016 Oct;196(1):48-56. doi: 10.1016/j.jsb.2016.07.009. Epub 2016 Jul 16. J Struct Biol. 2016. PMID: 27431447 Review. - Regulation of Clathrin-Mediated Endocytosis.
Mettlen M, Chen PH, Srinivasan S, Danuser G, Schmid SL. Mettlen M, et al. Annu Rev Biochem. 2018 Jun 20;87:871-896. doi: 10.1146/annurev-biochem-062917-012644. Epub 2018 Apr 16. Annu Rev Biochem. 2018. PMID: 29661000 Free PMC article. Review.
Cited by
- Dynamic interplay between cell membrane tension and clathrin-mediated endocytosis.
Djakbarova U, Madraki Y, Chan ET, Kural C. Djakbarova U, et al. Biol Cell. 2021 Aug;113(8):344-373. doi: 10.1111/boc.202000110. Epub 2021 Apr 28. Biol Cell. 2021. PMID: 33788963 Free PMC article. Review. - Membrane fission is promoted by insertion of amphipathic helices and is restricted by crescent BAR domains.
Boucrot E, Pick A, Çamdere G, Liska N, Evergren E, McMahon HT, Kozlov MM. Boucrot E, et al. Cell. 2012 Mar 30;149(1):124-36. doi: 10.1016/j.cell.2012.01.047. Cell. 2012. PMID: 22464325 Free PMC article. - Asymmetric formation of coated pits on dorsal and ventral surfaces at the leading edges of motile cells and on protrusions of immobile cells.
Kural C, Akatay AA, Gaudin R, Chen BC, Legant WR, Betzig E, Kirchhausen T. Kural C, et al. Mol Biol Cell. 2015 Jun 1;26(11):2044-53. doi: 10.1091/mbc.E15-01-0055. Epub 2015 Apr 7. Mol Biol Cell. 2015. PMID: 25851602 Free PMC article. - Linking up at the BAR: Oligomerization and F-BAR protein function.
McDonald NA, Gould KL. McDonald NA, et al. Cell Cycle. 2016 Aug 2;15(15):1977-85. doi: 10.1080/15384101.2016.1190893. Epub 2016 May 31. Cell Cycle. 2016. PMID: 27245932 Free PMC article. Review. - Alzheimer's Disease: APP, Gamma Secretase, APOE, CLU, CR1, PICALM, ABCA7, BIN1, CD2AP, CD33, EPHA1, and MS4A2, and Their Relationships with Herpes Simplex, C. Pneumoniae, Other Suspect Pathogens, and the Immune System.
Carter C. Carter C. Int J Alzheimers Dis. 2011;2011:501862. doi: 10.4061/2011/501862. Epub 2011 Dec 29. Int J Alzheimers Dis. 2011. PMID: 22254144 Free PMC article.
References
- Doherty G. J, McMahon H. T. Mechanisms of endocytosis. Annu Rev Biochem. 2009;78:857–902. - PubMed
- Ehrlich M, Boll W, Van Oijen A, Hariharan R, Chandran K, et al. Endocytosis by random initiation and stabilization of clathrin-coated pits. Cell. 2004;118:591–605. - PubMed
- Gaidarov I, Santini F, Warren R. A, Keen J. H. Spatial control of coated-pit dynamics in living cells. Nat Cell Biol. 1999;1:1–7. - PubMed
- Peter B. J, Kent H. M, Mills I. G, Vallis Y, Butler P. J, et al. BAR domains as sensors of membrane curvature: the amphiphysin BAR structure. Science. 2004;303:495–499. - PubMed
Publication types
MeSH terms
Substances
LinkOut - more resources
Full Text Sources
Other Literature Sources
Research Materials
Miscellaneous
