Diffuse traumatic axonal injury in the mouse induces atrophy, c-Jun activation, and axonal outgrowth in the axotomized neuronal population - PubMed (original) (raw)
Comparative Study
Diffuse traumatic axonal injury in the mouse induces atrophy, c-Jun activation, and axonal outgrowth in the axotomized neuronal population
John E Greer et al. J Neurosci. 2011.
Abstract
Traumatic axonal injury (TAI) is a consistent component of traumatic brain injury (TBI) and is associated with much of its morbidity. Little is known regarding the long-term retrograde neuronal consequences of TAI and/or the potential that TAI could lead to anterograde axonal reorganization and repair. To investigate the repertoire of anterograde and retrograde responses triggered by TIA, Thy1-YFP-H mice were subjected to mild central fluid percussion injury and killed at various times between 15 min and 28 d post-injury. Based upon confocal assessment of the endogenous neuronal fluorescence, such injury was found to result in diffuse TAI throughout layer V of the neocortex within yellow fluorescent protein (YFP)-positive axons. When these fluorescent approaches were coupled with various quantitative and immunohistochemical approaches, we found that this TAI did not result in neuronal death over the 28 d period assessed. Rather, it elicited neuronal atrophy. Within these same axotomized neuronal populations, TAI was also found to induce an early and sustained activation of the transcription factors c-Jun and ATF-3 (activating transcription factor 3), known regulators of axon regeneration. Parallel ultrastructural studies confirmed that these reactive changes are consistent with atrophy in the absence of neuronal death. Concurrent with those events ongoing in the neuronal cell bodies, their downstream axonal segments revealed, as early as 1 d post-injury, morphological changes consistent with reactive sprouting that was accompanied by significant axonal elongation over time. Collectively, these TAI-linked events are consistent with sustained neuronal recovery, an activation of a regenerative genetic program, and subsequent axonal reorganization suggestive of some form of regenerative response.
Figures
Figure 1.
Diffuse brain trauma results in traumatically induced axotomy in YFP-H mice (1 d post-injury). A, YFP-H mice express YFP predominantly within layer V of the neocortex. B–E, Moderate cFPI in YFP-H mice induces axotomy throughout the mediodorsal neocortex (B, C, E, arrows). Note the diffuse nature of the injury with the axons of several neurons sustaining axotomy (B, C, E) situated adjacent to what appear to be healthy neurons with intact axonal projections (D). Further note that this diffuse axotomy occurs without any evidence of hemorrhage or overt tissue damage. Cells in B–D are located within the closed box area in A, while the cell in D is located within dotted boxed area in A. Scale bars: A, 500 μm, (in E) B–E, 20 μm.
Figure 2.
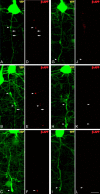
β-APP is localized to proximal axotomized YFP+ processes at early time points following cFPI but is absent at chronic time points post-injury. A–L, Representative images of YFP+ axons demonstrating pathological alteration at 15 m (A, D), 1 h (B, E), 1 d (C, F), 2 d (G, J), 3 d (H, K), and 7 d (I, L) post-injury. Arrowheads indicate proximal swellings. Arrows indicate distal swellings. Note the lack of APP immunoreactivity within proximal YFP+ axonal profiles at 2 d (J), 3 d (K), and 7 d (L) post-injury. Also, where visible, note the lack of APP immunoreactivity within distal YFP+ swellings (arrows). YFP, Green; APP, red. Scale bar: 20 μm.
Figure 3.
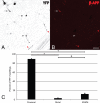
β-APP is predominantly localized to proximal but not distal or SCWM YFP+ swellings. A–C, Representative image of an axotomized YFP+ neuron (A) labeled with APP (B). The percentage of proximal YFP+ swellings (white/black arrows) exhibiting APP immunoreactivity is significantly greater (C) than the percentage of distal (white/black arrowheads) and SCWM (red arrowheads) YFP+ swellings that are immunopositive for APP. +p < 0.001; *p < 0.01. Scale bar: (in B) A, B, 40 μm.
Figure 4.
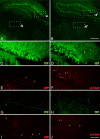
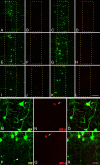
Phospho-c-Jun expression is spatially restricted to regions associated with TAI following cFPI. A–J, Representative images of the hippocampus and the thalamus of injured YFP+ mice 1 d following cFPI (A, B) immunolabeled with antibodies targeting β-APP (APP) (C, E, G, I) and phospho-c-Jun (p-c-Jun) (D, F, H, J). Note that APP+ axonal swellings can be observed within the dentate gyrus of the hippocampus (C, E, arrows) as well as the dorsolateral thalamic nuclei (G, I, arrows). Also note that phospho-c-Jun+ cells (D, F, H, J, arrowheads) can be found within the same anatomical regions. Insets: a, C and E; b, G and I; **a**′, D and F; **b**′, H and J. Scale bars: (in B) A, B, 250 μm; (in J) C–J, 50 μm.
Figure 5.
Phospho-c-Jun expression in the neocortex is restricted to cells within layer V and persists up to 28 d post-injury. A–T, Representative images of phospho-c-Jun expression in injured (Inj) YFP mice at 1 d (A, B), 3 d (E, F), 7 d (I, J), 14 d (M, N), and 28 d (Q, R) and in sham-injured animals at 1 d (C, D), 3 d (G, H), 7 d (K, L), 14 d (O, P), and 28 d (S, T). Elevated expression of phospho-c-Jun (p-c-Jun) is evident at 1 d post-injury (B) and persists as late as 28 d post-injury (R). Phospho-c-Jun expression is predominantly restricted to cells residing within layer V, the same neocortical layer that contains YFP+ neurons sustaining TAI (see dotted lines). No phospho-c-Jun+ cells within layer V were observed in sham-injured animals (D, H, L, P, T). Scale bar: 200 μm.
Figure 6.
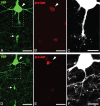
Phospho-c-Jun is predominantly expressed within neurons following cFPI. A–L, At 1 d post-injury, the majority of phospho-c-Jun+ (p-c-Jun) cells exhibit positive labeling for the neuronal marker NeuN (B–D, arrowheads) and are negative for the astrocytic marker GFAP (J–L). Only the occasional APC (CC1)+ oligodendrocyte expresses phospho-c-Jun following injury (F–H, arrowheads), and these can be easily distinguished from YFP+/phospho-c-Jun+ neurons. Note that all axotomized YFP+ neurons exhibiting swellings (A, E, I, arrows) also reveal phospho-c-Jun+ nuclei (B, F, J, arrows). Scale bar: (in L) A–L, 100 μm.
Figure 7.
Expression of phospho-c-Jun correlates with TAI following cFPI. A–E, YFP+ neurons at 1 d (A, B) and 3 d (C, D) post-injury were identified and classified into two groups: YFP+ neurons (red arrows) exhibiting unequivocal axon pathology (red arrowheads), and those YFP+ neurons (yellow arrows) with intact axons (yellow arrowheads) coursing into the SCWM. The percentage of neurons in each group that also express phospho-c-Jun (p-c-Jun) (B, C) at each time point is presented quantitatively in E. *p < 0.001 Scale bar: (in D) A–D, 40 μm.
Figure 8.
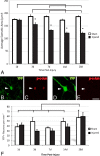
TAI results in chronic neuronal atrophy, not neuronal loss. A–F, Representative images of YFP+ neurons (see arrowheads) at 28 d post-injury (B, D) immunostained for phospho-c-Jun (p-c-Jun) (C, E). Note the atrophic change within the YFP+/phospho-c-Jun+ neuronal population (B, C) when compared to the YFP+/phospho-c-Jun-negative population (D, E), which is demonstrated quantitatively in A. No significant loss of YFP+ pyramidal neurons was observed at any time point studied (1–28 d) (F). The significant increase in the total number of YFP+ neurons observed at 28 d post-injury when compared to all other groups likely reflects an increase in the expression of YFP as animals age. Lines indicate a significant difference (p < 0.05) between time points, and the asterisk (*) indicates a significant difference from sham (p < 0.001). Scale bar: (in E) B–E, 20 μm.
Figure 9.
Ultrastructural evidence of persistent reactive change within axotomized neurons. A–D, Representative images from phospho-c-Jun+ neurons at 7 d (A), 14 d (B, D, 2× inset), and 28 d (C) post-injury. In all cells phospho-c-Jun immunoreactivity is restricted to the nuclear compartment. Evidence for enduring chromatolytic change can be found in the lack of substantial RER profiles (A, D, white arrowheads) within phospho-c-Jun+ neurons at all time points examined. A neighboring phospho-c-Jun-negative neuron (B, D, upper cell) can be seen to contain abundant arrays of RER (B, D, black arrowheads delineate plasmalemmal border). Additionally, many neurons contain lysosomal debris and/or lipofuscin content (A, B, white arrows). At 28 d, scattered phospho-c-Jun+ neurons showed evidence for nucleolar reorganization in the form of giant fibrillar centers (C, asterisk), surrounded by the dense fibrillar component (C; f). Scale bars: A–C, 2 μm; D, 4 μm.
Figure 10.
The expression of activating transcription factor 3, ATF-3, is elevated in axotomized neurons following cFPI. A–L, Following cFPI in YFP+ mice (1 d, A; 3 d, E; 7 d, I; 14 d, C; 28, G; 3 d sham, K), ATF-3 expression is elevated as early as 1 d post-injury (B) in a very limited number of neurons. The number of ATF-3-positive neurons increases at both 3 d (F) and 7 d (J) post-injury. By 14 d (D) and 28 d (H) post-injury, expression returns to levels observed within layer V of sham-injured animals (L). M–R, YFP+ neurons at 3 d (M) and 7 d (P) with demonstrable axon pathology (arrowheads) are consistently found to express ATF-3 (arrows: 3 d, N; 7 d, Q; 3 d merged, O; 7 d merged, R). Scale bars: (in L) A–L, 100 μm; (in R) M–R, 25 μm.
Figure 11.
Early reactive sprouting in YFP+/phospho-c-Jun neurons following cFPI. A–F, Representative images show a subpopulation of axotomized neurons at 1 d (A–C) and 3 d (D–F) post-injury detailing the morphology of their proximal axonal processes. This population of YFP+ (A, D, arrowheads), phospho-c-Jun (p-c-Jun)-expressing (B, E, arrowheads) neurons revealed evidence for sprouting following injury. Small axon sprouts (C, F, arrowheads) arise from what remained of the proximal axonal segment. Note the remaining disconnected distal YFP+ swellings (A, D, arrows). Scale bars: A, B, D, E, 20 μm; C, F, 10 μm.
Figure 12.
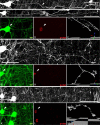
YFP+ neurons expressing phospho-c-Jun at later time points post-injury exhibit morphological evidence of continued axon regeneration and/or plasticity. A, Representative image of normal YFP+ axonal morphology (arrowheads) present in 28 d sham-injured animals. B–M, Representative images of YFP+/phospho-c-Jun+ neurons at 14 d (B–I) and 28 d (J–M) post-injury. Detailed axonal morphology of YFP+ neurons is shown in B, F, and J. The same YFP+ neurons (C, G, K) all expressed phospho-c-Jun (p-c-Jun) (D, H, L, arrowheads). These YFP+/phospho-c-Jun+ neurons at 14 and 28 d consistently maintained axons that were no longer swollen nor displayed overt pathological alteration. Rather, they now displayed long, thin axonal profiles decorated by several small dilations along their length (B, F, J, arrowheads). These were capped by torpedo-shaped swellings (B, F, J, arrows). Reconstructed three-dimensional images depicting the terminal swellings for each neuron are shown in E, I, M. Scale bars: A, B, J, 50 μm; F, 25 μm.
Figure 13.
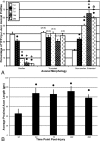
YFP+/phospho-c-Jun+ axonal morphological change with time post-injury. A, In this bar graph the percentage of axons with prominent swellings within the YFP+/phospho-c-Jun+ population is seen to decrease significantly at 3 d post-injury. Note that this trend continues with a further significant decrease at 7, 14, and 28 d post-injury. Concurrently, the percentage of nonswollen, elongated axons increases as early as 3 d post-injury and continued to increase significantly at 7, 14, and 28 d post-injury. In contrast, also note that the percentage of truncated YFP+/phospho-c-Jun+ axons does not change significantly over the same time course, although the percentage of this population showing evidence for reactive sprouting (values in brackets) diminishes over time post-injury. B, The average proximal axon length was significantly increased at 3, 7, 14, and 28 d post-injury relative to 1 d post-injury. *p < 0.05, significantly different from 1 d; +p < 0.001, significantly different from 3 d; Δ_p_ < 0.001, significantly different from 7 d.
Similar articles
- Traumatic axonal injury in the optic nerve: evidence for axonal swelling, disconnection, dieback, and reorganization.
Wang J, Hamm RJ, Povlishock JT. Wang J, et al. J Neurotrauma. 2011 Jul;28(7):1185-98. doi: 10.1089/neu.2011.1756. Epub 2011 Jul 12. J Neurotrauma. 2011. PMID: 21506725 Free PMC article. - Diffuse traumatic axonal injury in the optic nerve does not elicit retinal ganglion cell loss.
Wang J, Fox MA, Povlishock JT. Wang J, et al. J Neuropathol Exp Neurol. 2013 Aug;72(8):768-81. doi: 10.1097/NEN.0b013e31829d8d9d. J Neuropathol Exp Neurol. 2013. PMID: 23860030 Free PMC article. - All roads lead to disconnection?--Traumatic axonal injury revisited.
Büki A, Povlishock JT. Büki A, et al. Acta Neurochir (Wien). 2006 Feb;148(2):181-93; discussion 193-4. doi: 10.1007/s00701-005-0674-4. Epub 2005 Dec 20. Acta Neurochir (Wien). 2006. PMID: 16362181 Review. - Intra-axonal mechanisms driving axon regeneration.
Smith TP, Sahoo PK, Kar AN, Twiss JL. Smith TP, et al. Brain Res. 2020 Aug 1;1740:146864. doi: 10.1016/j.brainres.2020.146864. Epub 2020 Apr 28. Brain Res. 2020. PMID: 32360100 Free PMC article. Review.
Cited by
- Electrophysiological abnormalities in both axotomized and nonaxotomized pyramidal neurons following mild traumatic brain injury.
Greer JE, Povlishock JT, Jacobs KM. Greer JE, et al. J Neurosci. 2012 May 9;32(19):6682-7. doi: 10.1523/JNEUROSCI.0881-12.2012. J Neurosci. 2012. PMID: 22573690 Free PMC article. - Relationship between brain volume reduction during the acute phase of sepsis and activities of daily living in elderly patients: A prospective cohort study.
Hosokawa T, Kinoshita K, Ihara S, Nakagawa K, Iguchi U, Hirabayashi M, Mutoh T, Sawada N, Kuwana T, Yamaguchi J. Hosokawa T, et al. PLoS One. 2023 May 16;18(5):e0284886. doi: 10.1371/journal.pone.0284886. eCollection 2023. PLoS One. 2023. PMID: 37192211 Free PMC article. - Persistent increase of Nogo-A-positive cells and dynamic reduction in oligodendroglia lineage cells in white matter regions following experimental and clinical traumatic brain injury.
Ruscher K, Michalettos G, Abu Hamdeh S, Clausen F, Nolan AL, Flygt J, Özen I, Marklund N. Ruscher K, et al. J Neuropathol Exp Neurol. 2025 May 1;84(5):423-435. doi: 10.1093/jnen/nlaf017. J Neuropathol Exp Neurol. 2025. PMID: 40085014 Free PMC article. - Critical role of trkB receptors in reactive axonal sprouting and hyperexcitability after axonal injury.
Aungst S, England PM, Thompson SM. Aungst S, et al. J Neurophysiol. 2013 Feb;109(3):813-24. doi: 10.1152/jn.00869.2012. Epub 2012 Nov 14. J Neurophysiol. 2013. PMID: 23155176 Free PMC article. - Semaphorin 7a links nerve regeneration and inflammation in the cornea.
Namavari A, Chaudhary S, Ozturk O, Chang JH, Yco L, Sonawane S, Katam N, Khanolkar V, Hallak J, Sarkar J, Jain S. Namavari A, et al. Invest Ophthalmol Vis Sci. 2012 Jul 9;53(8):4575-85. doi: 10.1167/iovs.12-9760. Invest Ophthalmol Vis Sci. 2012. PMID: 22700709 Free PMC article.
References
- Adams JH, Doyle D, Ford I, Gennarelli TA, Graham DI, McLellan DR. Diffuse axonal injury in head injury: definition, diagnosis and grading. Histopathology. 1989;15:49–59. - PubMed
- Barron KD. The axotomy response. J Neurol Sci. 2004;220:119–121. - PubMed
- Barron KD, Dentinger MP. Cytologic observations on axotomized feline Betz cells. 1. Qualitative electron microscopic findings. J Neuropathol Exp Neurol. 1979;38:128–151. - PubMed
- Barron KD, Dentinger MP, Nelson LR, Mincy JE. Ultrastructure of axonal reaction in red nucleus of cat. J Neuropathol Exp Neurol. 1975;34:222–248. - PubMed
- Barron KD, Dentinger MP, Popp AJ, Mankes R. Neurons of layer Vb of rat sensorimotor cortex atrophy but do not die after thoracic cord transection. J Neuropathol Exp Neurol. 1988;47:62–74. - PubMed
Publication types
MeSH terms
Substances
Grants and funding
- NS007288/NS/NINDS NIH HHS/United States
- NS047463/NS/NINDS NIH HHS/United States
- R01 NS045824/NS/NINDS NIH HHS/United States
- P30 NS047463/NS/NINDS NIH HHS/United States
- T32 NS007288/NS/NINDS NIH HHS/United States
- 5P30NS047463-02/NS/NINDS NIH HHS/United States
- R01 HD055813/HD/NICHD NIH HHS/United States
- HD055813/HD/NICHD NIH HHS/United States
LinkOut - more resources
Full Text Sources
Miscellaneous

