Dietary fiber enhances TGF-β signaling and growth inhibition in the gut - PubMed (original) (raw)
Dietary fiber enhances TGF-β signaling and growth inhibition in the gut
Yanna Cao et al. Am J Physiol Gastrointest Liver Physiol. 2011 Jul.
Abstract
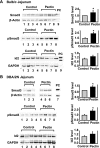
Dietary fiber intake links to decreased risk of colorectal cancers. The underlying mechanisms remain unclear. Recently, we found that butyrate, a short-chain fatty acid produced in gut by bacterial fermentation of dietary fiber, enhances TGF-β signaling in rat intestinal epithelial cells (RIE-1). Furthermore, TGF-β represses inhibitors of differentiation (Ids), leading to apoptosis. We hypothesized that dietary fiber enhances TGF-β's growth inhibitory effects on gut epithelium via inhibition of Id2. In this study, Balb/c and DBA/2N mice were fed with a regular rodent chow or supplemented with a dietary fiber (20% pectin) and Smad3 level in gut epithelium was measured. In vitro, RIE-1 cells were treated with butyrate and TGF-β(1), and cell functions were evaluated. Furthermore, the role of Ids in butyrate- and TGF-β-induced growth inhibition was investigated. We found that pectin feeding increased Smad3 protein levels in the jejunum (1.47 ± 0.26-fold, P = 0.045, in Balb/c mice; 1.49 ± 0.19-fold, P = 0.016, in DBA/2N mice), and phospho-Smad3 levels (1.92 ± 0.27-fold, P = 0.009, in Balb/c mice; 1.83 ± 0.28-fold, P = 0.022, in DBA/2N mice). Butyrate or TGF-β alone inhibited cell growth and induced cell cycle arrest. The combined treatment of butyrate and TGF-β synergistically induced cell cycle arrest and apoptosis in RIE-1 cells and repressed Id2 and Id3 levels. Furthermore, knockdown of Id2 gene expression by use of small interfering RNA caused cell cycle arrest and apoptosis. We conclude that dietary fiber pectin enhanced Smad3 expression and activation in the gut. Butyrate and TGF-β induced cell cycle arrest and apoptosis, which may be mediated by repression of Id2. Our results implicate a novel mechanism of dietary fiber in reducing the risk of colorectal cancer development.
Figures
Fig. 1.
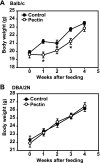
Effects of fiber feeding on body weight. All mice were weighed prior to the study and then weekly thereafter. The control mice were assigned to a control diet (Prolab RMH2500) and the experimental mice were assigned to an experimental diet (Prolab RMH2500 supplemented with 20% pectin prepared by Bio-Serv, Frenchtown, NJ). The body weight was recorded and plotted as means ± SE. A: Balb/c mice (n = 16). B: DBA/2N mice (n = 16). *P < 0.05 compared with the control mice.
Fig. 2.
Effects of fiber feeding on Smad3 protein expression and phosphorylation and inhibitor of differentiation (Id)2 protein expression in the mouse intestine. At week 4 after the feeding, the Balb/c and DBA/2N mice were euthanized and the jejuna were harvested. Mucosal tissue was collected and protein lysates were prepared. Smad3 and Id2 protein levels were detected by Western blotting using specific antibodies. β-Actin or GAPDH served as a protein loading control. Phospho-Smad3 (pSmad3) was detected by immunoprecipitation using an anti-Smad3 antibody followed by Western blotting using an anti-pSmad3 antibody. The same amount of protein (250 μg) for each sample was applied to IP. The protein levels were quantified and expressed as means ± SE of Smad3/β-actin (n = 16/group), pSmad3 level (n = 8/group), and Id2/GAPDH (n = 8/group) normalized to control. The representative images of Western blotting and quantifications of Smad3, pSmad3, and Id2 are shown. A: Balb/c jejunum. B: DBA/2N jejunum. *P < 0.05 compared with the control mice. PC1, positive control of the endogenous Smad3 protein prepared from rat intestinal epithelial (RIE-1) cells; PC2, positive control of Id2 protein prepared from the Cos-1 cells transiently transfected with flag-Id2.
Fig. 3.
Butyrate enhances the growth inhibitory effects of TGF-β. RIE-1 cells were treated with vehicle control, sodium butyrate (NaB, 5 mM), or TGF-β1 (40 pM) or pretreated with NaB (5 mM) followed by TGF-β1 treatment (40 pM). Cells were counted daily via a hemocytometer and expressed as means ± SE. *P < 0.05 compared with the control. #P < 0.05 compared with NaB or TGF-β1 alone.
Fig. 4.
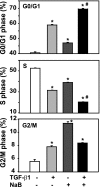
Butyrate enhances TGF-β-induced cell cycle arrest. The RIE-1 cells were treated with vehicle control, NaB (5 mM), or TGF-β1 (40 pM) or pretreated with NaB (5 mM) followed by TGF-β1 treatment (40 pM) for 24 h. The cells were pulsed with 5-bromo-2′-deoxyuridine (BrdU) during the last 45 min and harvested for flow cytometric analysis; 10,000 cells were analyzed from each well (n = 3 wells) and expressed as percentage of cells in different phases. *P < 0.05 compared with control. #P < 0.05 compared with NaB or TGF-β1 alone.
Fig. 5.
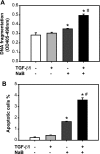
Butyrate and TGF-β synergistically induce apoptosis. RIE-1 cells were treated with vehicle control, NaB (5 mM), or TGF-β1 (40 pM) or pretreated with NaB (5 mM) followed by TGF-β1 treatment (40 pM) for 24 h. A: apoptosis was quantified via a cell death detection ELISA assay and expressed as means ± SE. B: apoptotic cells were stained with annexin V-FITC and propidium iodide. Cells were analyzed by flow cytometry. Cells staining with annexin V only were identified as apoptotic cells and expressed as means ± SE. *P < 0.05 compared with the control group. #P < 0.05 compared with TGF-β1 or NaB alone.
Fig. 6.
Butyrate induces alkaline phosphatase (ALP) expression. RIE-1 cells were treated with vehicle control, NaB (5 mM), or TGF-β1 (40 pM) or pretreated with NaB (5 mM) followed by TGF-β1 treatment (40 pM). Cells were then harvested at 4 and 12 h after TGF-β1 treatment. Total RNA was extracted and converted to cDNA. Real-time PCR was applied to measure ALP gene expression and normalized to 18S mRNA level. ALP mRNA levels were represented as fold of control.
Fig. 7.
Butyrate enhances TGF-β repression of Id2 and Id3 expression. The RIE-1 cells were treated the same way as in Fig. 6. A: total RNA was extracted and converted to cDNA. Real-time PCR was applied to measure Id1, Id2, and Id3 gene expression and normalized to 18S mRNA level. Id1, Id2, and Id3 mRNA levels were represented as fold of control. B: protein lysates were prepared for Western blotting analysis. Id proteins were detected by using the specific antibodies. β-Actin was a protein loading control. The relative ratio of Id to β-actin was normalized to control and represented as fold of control.
Fig. 8.
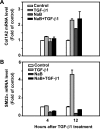
NaB differentially regulates TGF-β-induced Col1A2 and SM22α mRNA expression. The RIE-1 cells were treated the same way as in Fig. 6. Real-time PCR was applied to measure Col1A2 and SM22α gene expression and normalized to 18S mRNA level. Col1A2 (A) and SM22α (B) mRNA levels were represented as fold of control.
Fig. 9.
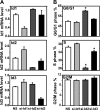
Knockdown of Id2 gene expression induces cycle arrest. The RIE-1 cells were transfected with rat Id1, Id2, and Id3 small interfering (si)RNA (50 nmol/l) by using DharmaFECT3 in DMEM supplemented with 5% dialyzed fetal bovine serum (dFBS) for 24 h. Scrambled siRNA was used as nonspecific control (NS). The cells were pulsed with BrdU during the last 45 min and harvested for flow cytometric analysis. A: total RNA was prepared and converted to cDNA for real-time quantitative PCR analysis of Id1, Id2, and Id3 mRNA expression. Id mRNA levels were represented as fold of control. B: cells in different phases of the cell cycle were expressed as means ± SE. *P < 0.05 compared with NS control group.
Fig. 10.
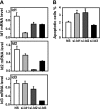
Knockdown of Id2 gene expression induces apoptosis. The RIE-1 cells were transfected with rat Id1, Id2, and Id3 siRNA (50 nmol/l) by using DharmaFECT3 in DMEM supplemented with 5% dFBS for 24 h. Scrambled siRNA was used as nonspecific control. A: total RNA was prepared and converted to cDNA for real-time quantitative PCR analysis of Id1, Id2, and Id3 mRNA expression. Id mRNA levels were represented as fold of control. B: apoptotic cells were stained with annexin V-FITC and propidium iodide. Cells were analyzed by flow cytometry and the cells stained only with annexin V were identified as apoptotic cells. Results are expressed as means ± SE. *P < 0.05 compared with NS control group.
Fig. 11.
Schematic illustration of the potential interaction of dietary fiber with the TGF-β signaling pathway. Upon binding to its receptors (TβRs) on the gut epithelial cells, TGF-β activates (or phosphorylates) Smad3 and inhibits Id2 expression. Butyrate, derived from dietary fiber in the gut, acts on the gut epithelial cells to increase Smad3 expression and subsequently to inhibit Id2 expression, thereby enhancing TGF-β-induced growth inhibition through cell cycle arrest and apoptosis induction.
Similar articles
- Dietary fiber enhances a tumor suppressor signaling pathway in the gut.
Nguyen KA, Cao Y, Chen JR, Townsend CM Jr, Ko TC. Nguyen KA, et al. Ann Surg. 2006 May;243(5):619-25; discussion 625-7. doi: 10.1097/01.sla.0000216783.85214.c1. Ann Surg. 2006. PMID: 16632996 Free PMC article. - TGF-beta repression of Id2 induces apoptosis in gut epithelial cells.
Cao Y, Liu X, Zhang W, Deng X, Zhang H, Liu Y, Chen L, Thompson EA, Townsend CM Jr, Ko TC. Cao Y, et al. Oncogene. 2009 Feb 26;28(8):1089-98. doi: 10.1038/onc.2008.456. Epub 2009 Jan 12. Oncogene. 2009. PMID: 19137015 Free PMC article. - Anti-cancer effects of butyrate: use of micro-array technology to investigate mechanisms.
Williams EA, Coxhead JM, Mathers JC. Williams EA, et al. Proc Nutr Soc. 2003 Feb;62(1):107-15. doi: 10.1079/PNS2002230. Proc Nutr Soc. 2003. PMID: 12740065 Review.
Cited by
- Secondary Bile Acids and Short Chain Fatty Acids in the Colon: A Focus on Colonic Microbiome, Cell Proliferation, Inflammation, and Cancer.
Zeng H, Umar S, Rust B, Lazarova D, Bordonaro M. Zeng H, et al. Int J Mol Sci. 2019 Mar 11;20(5):1214. doi: 10.3390/ijms20051214. Int J Mol Sci. 2019. PMID: 30862015 Free PMC article. Review. - Postbiotic butyrate: role and its effects for being a potential drug and biomarker to pancreatic cancer.
Elango A, Nesam VD, Sukumar P, Lawrence I, Radhakrishnan A. Elango A, et al. Arch Microbiol. 2024 Mar 13;206(4):156. doi: 10.1007/s00203-024-03914-8. Arch Microbiol. 2024. PMID: 38480544 Review. - The role of probiotics and prebiotics in inducing gut immunity.
Vieira AT, Teixeira MM, Martins FS. Vieira AT, et al. Front Immunol. 2013 Dec 12;4:445. doi: 10.3389/fimmu.2013.00445. Front Immunol. 2013. PMID: 24376446 Free PMC article. Review. - Chemoprevention in gastrointestinal physiology and disease. Natural products and microbiome.
Greiner AK, Papineni RV, Umar S. Greiner AK, et al. Am J Physiol Gastrointest Liver Physiol. 2014 Jul 1;307(1):G1-15. doi: 10.1152/ajpgi.00044.2014. Epub 2014 May 1. Am J Physiol Gastrointest Liver Physiol. 2014. PMID: 24789206 Free PMC article. Review. - Assessment of Cytotoxicity and Odontogenic/Osteogenic Differentiation Potential of Nano-Dentine Cement Against Stem Cells from Apical Papilla.
Saberi EA, Farhad Mollashahi N, Ejeian F, Nematollahi M, Shahraki O, Pirhaji A, Nasr Esfahani MH. Saberi EA, et al. Cell J. 2022 Nov 2;24(11):637-646. doi: 10.22074/cellj.2022.8126. Cell J. 2022. PMID: 36377213 Free PMC article.
References
- Augeron C, Laboisse CL. Emergence of permanently differentiated cell clones in a human colonic cancer cell line in culture after treatment with sodium butyrate. Cancer Res 44: 3961–3969, 1984 - PubMed
- Blay J, Brown KD. Characterization of an epithelioid cell line derived from rat small intestine: demonstration of cytokeratin filaments. Cell Biol Int Rep 8: 551–560, 1984 - PubMed
- Burkitt DP. Epidemiology of cancer of the colon and rectum. Cancer 28: 3–13, 1971 - PubMed
- Cairnie AB, Lamerton LF, Steel GG. Cell proliferation studies in the intestinal epithelium of the rat. I. Determination of the kinetic parameters. Exp Cell Res 39: 528–538, 1965 - PubMed
Publication types
MeSH terms
Substances
LinkOut - more resources
Full Text Sources
Medical
