Applications of mass spectrometry to lipids and membranes - PubMed (original) (raw)
Review
Applications of mass spectrometry to lipids and membranes
Richard Harkewicz et al. Annu Rev Biochem. 2011.
Abstract
Lipidomics, a major part of metabolomics, constitutes the detailed analysis and global characterization, both spatial and temporal, of the structure and function of lipids (the lipidome) within a living system. As with proteomics, mass spectrometry has earned a central analytical role in lipidomics, and this role will continue to grow with technological developments. Currently, there exist two mass spectrometry-based lipidomics approaches, one based on a division of lipids into categories and classes prior to analysis, the "comprehensive lipidomics analysis by separation simplification" (CLASS), and the other in which all lipid species are analyzed together without prior separation, shotgun. In exploring the lipidome of various living systems, novel lipids are being discovered, and mass spectrometry is helping characterize their chemical structure. Deuterium exchange mass spectrometry (DXMS) is being used to investigate the association of lipids and membranes with proteins and enzymes, and imaging mass spectrometry (IMS) is being applied to the in situ analysis of lipids in tissues.
Figures
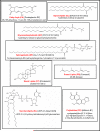
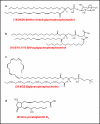
Figure 1
Examples of each of the eight categories of lipids as defined by the Lipid Metabolites and Pathways Strategy (LIPID MAPS) Consortium.
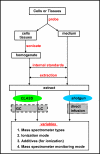
Figure 2
Flow chart depicting the lipid sample preparation and analysis protocol. After extraction, the
c
omprehensive
l
ipidomics
a
nalysis by
s
eparation
s
implification (CLASS) or shotgun lipidomics approach is carried out. GC, gas chromatography; LC, liquid chromatography.
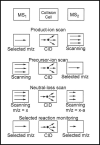
Figure 3
Various modes of tandem mass spectrometric analyses available on the triple quadrupole instrument. Reprinted with permission from Reference .
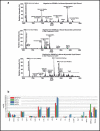
Figure 4
Examples of shotgun lipidomics. (a) Demonstration of intrasource separation, which is used to minimize ion suppression and improve detection of low-level species. Reprinted with permission from Reference . (b) Comparison of the lipid composition of yeast cells for wild-type (BY4741) cells versus those with a fatty acid elongase gene mutation (elo1Δ, elo2Δ, elo3Δ. Reprinted with permission from Reference .
Figure 5
Example of a comprehensive lipidomics analysis by separation simplification (CLASS) approach. A heat map shows the temporal changes of various lipid metabolites (prostaglandins), as well as gene expression, in endotoxin-stimulated mouse macrophage cells. Enzymes are shown in red font and the prostaglandin lipid metabolites are shown in blue font. The arrows depict the synthesis pathways, including various metabolite intermediates and corresponding enzymes. Changes are represented as a function of time (left to right), where rectangles indicate mRNA levels and circles indicate lipid metabolite levels. Greater intensity of red indicates increasing levels; greater intensity of green indicates decreasing levels; and gray represents no change in levels relative to unstimulated cells. When enzyme activity can result from multiple genes, each is represented as a separate line. Redrawn and reprinted with permission from Reference .
Figure 6
Examples of a few of the novel species observed recently in untargeted lipidomics mass spectrometry-based assays. References , , -, .
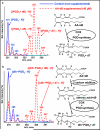
Figure 7
Example of the
d
iverse
i
sotope
m
etabolic
p
rofiling of
l
abeled
e
xogenous
s
ubstrates using
m
ass
s
pectrometry (DIMPLES/MS) approach. (a) The characteristic doublet pattern, the observation of prostaglandin D2 (PGD2), and deuterium-labeled PGD2 produced by macrophage cells supplemented with deuterium-labeled arachidonic acid (AA-d8). (b) The unexpected observation of 22-carbon dihomo-prostaglandin D2 (dih-PGD2), resulting from the 2-carbon elongation of arachidonic acid (AA). Redrawn and reprinted with permission from Reference . amu, atomic mass unit; COX, cyclooxygenase; m/z, mass-to-charge ratio.
Figure 8
Deuterium exchange mass spectrometry (DXMS) used to investigate protein/enzyme associations with lipids. (a) Hydrogen atoms contained on a protein molecule can be divided into three classes based on their rate of exchange with the aqueous solvent. Those attached directly to carbon atoms (blue) hardly ever exchange; those attached to amino acid side chain atoms, the N-terminal amine, and the C-terminal carboxylic acid (green) exchange extremely rapidly; and amide hydrogen atoms (red) have variable exchange rates from seconds to months depending on the protein conformation and solvent accessibility. (b) Depictions of the membrane interactions for representatives of the three main kinds of phospholipase A2 (PLA2), (i) the small secreted sPLA2 (reprinted with permission from Reference 59), (ii) the cytosolic cPLA (reprinted with permission from Reference 60), and (iii) the calcium-independent iPLA2 (reprinted with permission from Reference 61). Each has a different and distinct interaction with the phospholipid membrane.
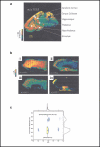
Figure 9
Examples of matrix-assisted laser desorption ionization imaging mass spectrometry used to investigate lipids in tissue samples. (a) Extracted ion image for m/z = 772.5 from a mouse brain slice. The mass of 772.5 Da corresponds to the 16:0/16:0-PC + K+ (potassium cation adduct) species. (b) Images from a section of mouse kidney. Using MS/MS scan mode and high mass accuracy to confirm identity, cholesterol (i), 16:0/18:2-PC (ii), 40:6-PC (iii), and 16:0/20:4/18:1-TAG (iv) were some of the lipid species observed. Panels a and b reprinted with permission from Reference . (c) Example of an ion mobility-mass spectrometry (IM-MS) two-dimensional plot for a nominally isobaric peptide (RPPGGFSP) and lipid (32:4-PC). The mass-to-charge ratio (m/z) is plotted on the x-axis, and ion mobility drift time is plotted on the y-axis. The mass-to-charge ratio signals overlap and cannot be resolved; however, they clearly have different ion mobility drift times. Reprinted with permission from Reference .
Similar articles
- Mass spectrometry: from proteomics to metabolomics and lipidomics.
Griffiths WJ, Wang Y. Griffiths WJ, et al. Chem Soc Rev. 2009 Jul;38(7):1882-96. doi: 10.1039/b618553n. Epub 2009 Feb 4. Chem Soc Rev. 2009. PMID: 19551169 Review. - Applications of ion-mobility mass spectrometry for lipid analysis.
Paglia G, Kliman M, Claude E, Geromanos S, Astarita G. Paglia G, et al. Anal Bioanal Chem. 2015 Jul;407(17):4995-5007. doi: 10.1007/s00216-015-8664-8. Epub 2015 Apr 17. Anal Bioanal Chem. 2015. PMID: 25893801 Review. - Recent advances of chromatography and mass spectrometry in lipidomics.
Li M, Zhou Z, Nie H, Bai Y, Liu H. Li M, et al. Anal Bioanal Chem. 2011 Jan;399(1):243-9. doi: 10.1007/s00216-010-4327-y. Epub 2010 Oct 30. Anal Bioanal Chem. 2011. PMID: 21052649 Review. - Comprehensive Evaluation of a Quantitative Shotgun Lipidomics Platform for Mammalian Sample Analysis on a High-Resolution Mass Spectrometer.
Nielsen IØ, Vidas Olsen A, Dicroce-Giacobini J, Papaleo E, Andersen KK, Jäättelä M, Maeda K, Bilgin M. Nielsen IØ, et al. J Am Soc Mass Spectrom. 2020 Apr 1;31(4):894-907. doi: 10.1021/jasms.9b00136. Epub 2020 Mar 4. J Am Soc Mass Spectrom. 2020. PMID: 32129994 - Shotgun lipidomics on a LTQ Orbitrap mass spectrometer by successive switching between acquisition polarity modes.
Schuhmann K, Almeida R, Baumert M, Herzog R, Bornstein SR, Shevchenko A. Schuhmann K, et al. J Mass Spectrom. 2012 Jan;47(1):96-104. doi: 10.1002/jms.2031. J Mass Spectrom. 2012. PMID: 22282095
Cited by
- Innate immune response in acute critical illness: a narrative review.
Stiel L, Gaudet A, Thietart S, Vallet H, Bastard P, Voiriot G, Oualha M, Sarton B, Kallel H, Brechot N, Kreitmann L, Benghanem S, Joffre J, Jouan Y; la Commission de Recherche Translationnelle de la Société de Réanimation en Langue Française. Stiel L, et al. Ann Intensive Care. 2024 Sep 4;14(1):137. doi: 10.1186/s13613-024-01355-6. Ann Intensive Care. 2024. PMID: 39227416 Free PMC article. Review. - Lipidomics: a promising cancer biomarker.
Yan F, Zhao H, Zeng Y. Yan F, et al. Clin Transl Med. 2018 Jul 30;7(1):21. doi: 10.1186/s40169-018-0199-0. Clin Transl Med. 2018. PMID: 30058036 Free PMC article. - Lipidomics technologies at the end of the first decade and the beginning of the next.
Merrill AH, Dennis EA, McDonald JG, Fahy E. Merrill AH, et al. Adv Nutr. 2013 Sep 1;4(5):565-7. doi: 10.3945/an.113.004333. Adv Nutr. 2013. PMID: 24038259 Free PMC article. - Advances in single-cell metabolomics to unravel cellular heterogeneity in plant biology.
Pandian K, Matsui M, Hankemeier T, Ali A, Okubo-Kurihara E. Pandian K, et al. Plant Physiol. 2023 Sep 22;193(2):949-965. doi: 10.1093/plphys/kiad357. Plant Physiol. 2023. PMID: 37338502 Free PMC article. Review. - Is Lipid Metabolism of Value in Cancer Research and Treatment? Part I- Lipid Metabolism in Cancer.
Nassar AF, Nie X, Zhang T, Yeung J, Norris P, He J, Ogura H, Babar MU, Muldoon A, Libreros S, Chen L. Nassar AF, et al. Metabolites. 2024 May 29;14(6):312. doi: 10.3390/metabo14060312. Metabolites. 2024. PMID: 38921447 Free PMC article. Review.
References
- Kitano H. Systems biology: a brief overview. Science. 2002;295:1662–64. - PubMed
- Daviss B. Growing pains for metabolomics. Scientist. 2005;19(8):25–28.
- Gomase VS, Changbhale SS, Patil SA, Kale KV. Metabolomics. Curr. Drug Metab. 2008;9:89–98. - PubMed
- Thomson JJ. Rays of positive electricity. Phil. Mag. 1910;20(118):752–767.
Publication types
MeSH terms
Substances
LinkOut - more resources
Full Text Sources
Other Literature Sources
Research Materials
