Trans-endocytosis of CD80 and CD86: a molecular basis for the cell-extrinsic function of CTLA-4 - PubMed (original) (raw)
. 2011 Apr 29;332(6029):600-3.
doi: 10.1126/science.1202947. Epub 2011 Apr 7.
Yong Zheng, Kyoko Nakamura, Kesley Attridge, Claire Manzotti, Emily M Schmidt, Jennifer Baker, Louisa E Jeffery, Satdip Kaur, Zoe Briggs, Tie Z Hou, Clare E Futter, Graham Anderson, Lucy S K Walker, David M Sansom
Affiliations
- PMID: 21474713
- PMCID: PMC3198051
- DOI: 10.1126/science.1202947
Trans-endocytosis of CD80 and CD86: a molecular basis for the cell-extrinsic function of CTLA-4
Omar S Qureshi et al. Science. 2011.
Abstract
Cytotoxic T lymphocyte antigen 4 (CTLA-4) is an essential negative regulator of T cell immune responses whose mechanism of action is the subject of debate. CTLA-4 shares two ligands (CD80 and CD86) with a stimulatory receptor, CD28. Here, we show that CTLA-4 can capture its ligands from opposing cells by a process of trans-endocytosis. After removal, these costimulatory ligands are degraded inside CTLA-4-expressing cells, resulting in impaired costimulation via CD28. Acquisition of CD86 from antigen-presenting cells is stimulated by T cell receptor engagement and observed in vitro and in vivo. These data reveal a mechanism of immune regulation in which CTLA-4 acts as an effector molecule to inhibit CD28 costimulation by the cell-extrinsic depletion of ligands, accounting for many of the known features of the CD28-CTLA-4 system.
Figures
Fig. 1
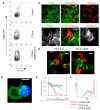
CTLA-4 mediated acquisition of co-stimulatory molecules. (A) Flow cytometric analysis of CD86-GFP transfer into CTLA-4 expressing cells. CHO cells expressing CD86-GFP (Far Red labeled) were co-cultured with CHO controls or with CTLA-4+ CHO cells in the presence or absence of 10 nM Bafilomycin A. Singlet CTLA-4 expressing cells were analyzed for GFP acquisition by excluding Far Red+ donor cells from analysis (see fig. S1) (B) Projection of a confocal z-stack showing a CTLA-4+ CHO cell (blue) in contact with a CD86 GFP-expressing CHO cell (green) in the presence of Bafilomycin A (BafA). GFP inside the CTLA-4 cell appears as cyan puncta. (C) Confocal micrographs of adherent CD86-expressing CHO cells and CTLA-4+ CHO cells after overnight incubation. CD86 (green) and CTLA-4 (red) were detected by antibody staining. Co-localization of CD86 and CTLA-4 is shown in yellow. Lower panels show an enlargement of the boxed area, with single color images shown in white for equal contrast. CHO-CD86 cultured alone are shown in fig. S7A. (D) Confocal images of cells expressing wild type (wt) CTLA-4 or CTLA-4 lacking the cytoplasmic domain (del36) (red) incubated for 2 hours with CD86-GFP (green) expressing cells. (E) Flow cytometric analysis of CD86 surface expression on CHO-CD86 cells co-incubated with increasing numbers of untransfected (control), wild-type CTLA-4 or CTLA-4 del36 cells (expressed as % CTLA-4+ cells in the co-culture). Surface CD86 was detected by antibody staining. (F) Response of CFSE-labelled CD4+CD25−T cells stimulated in the presence of anti-CD3 antibody with CD86-expressing cells fixed after co-culture with CTLA-4 WT or CTLA-4 del36. All data are single representatives of 3 or more independent experiments, Scale bars are 10 μm.
Fig. 2
Human T cells use CTLA-4 to remove CD86 from dendritic cells. (A) Typical CD86 expression on a human monocyte-derived dendritic cell (DC) cultured in the absence of T cells. (B) DC cultured for 72h with anti-CD3-activated CD4+CD25−T cells (outlined in white) stained with anti-CD86 (green) and anti-CTLA-4 (red). Single staining is shown as white for equal contrast. Cells were co-cultured in the absence or presence of blocking anti-CTLA-4. (C) Quantitation of surface CD80 and CD86 expression on DCs after co-culture with T cells in the presence or absence of anti-CTLA-4 determined by flow cytometry. Data show MFI change pooled from >5 experiments with SEM. (D) Confocal micrographs of allogeneic DCs co-cultured overnight with CTLA-4-transfected (CTLA-4 TF) or control resting CD4+CD25−human T cells. Cultures were fixed and stained with anti-CD86 (green) or anti-HLA-DR (red). White arrowsheads highlight position of T cells, green arrowsheads highlight DCs. White images show single color staining for contrast. (E) Mean fluorescence intensity of surface CD86 on DCs after incubation with either CTLA-4-transfected or control T cells as determined by flow cytometry. All data are representative of at least 3 independent experiments. Error bars represent the SEM. Scale bars = 10 μM.
Fig. 3
TCR stimulation promotes CTLA-4 trafficking and trans-endocytosis of CD86. (A) Acquisition of CD86-GFP from CHO cells by human CD4+ T cell blasts in the presence or absence of anti-CD3 stimulation. Right hand panels show the effect of anti-CTLA-4 antibody on GFP uptake. (B) SEB-specific CD4+ T cell blasts were incubated with either unpulsed or SEB-pulsed DCs. Cells were fixed and stained with anti-CD86 (green) and anti-CTLA-4 (red). Yellow indicates colocalization. Single colors are shown in white for equal contrast. (C) Surface levels of CD86 on DCs incubated with SEB-specific T cell blasts for 16h as determined by flow cytometry. (D) CD4+CD25+ (Treg) or CD4+CD25−T cells were incubated with DCs and anti-CD3 overnight, fixed, stained using anti-CD86 (green), anti-CD3 for T cells (blue), and visualized by confocal microscopy. Yellow arrow indicates CD86 puncta within T cells. (E) Surface levels of CD86 on DCs incubated with CD4+CD25+ (Treg) and CD4+CD25−T cells overnight determined by flow cytometry. All data are representative of at least 3 independent experiments. Error bars represent the SEM. Scale bars = 10 μM.
Fig. 4
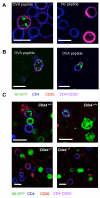
In vivo capture of CD86 by CTLA-4. Balbc Rag2−/− mice were reconstituted with CD86-GFP transduced Balbc Rag2−/− bone marrow to permit the development of APC expressing CD86-GFP. 3wk later mice were injected with DO11.10 CD4+ T cells and immunized as described in figure S16. (A) 6h after i.v. OVA peptide re-challenge, splenocytes were harvested, labeled at 4°C for CD4 (blue) and CD25 (red) and immediately imaged by confocal microscopy. Representative images of T cells from OVA peptide challenged or unchallenged mice are shown. (B) Representative images of CD4+ T cells purified from spleen after treatment in vivo with peptide showing CD4 and CD25 staining. (C) CD4+ T cells from either Ctla-4+/+ or Ctla-4−/− (Rag2−/− DO11.10 Rip-mOVA) mice were injected into mice that previously received CD86-GFP Rag2−/− bone marrow cells. Cells were re-challenged with OVA in vivo as above. Splenocytes were isolated and immediately analyzed for CD86-GFP (green), CD25 (red) CD4 (blue) by confocal microscopy. Two representative panels are shown for both Ctla-4+/+ and Ctla-4−/− conditions. Data are representative of 3 independent experiments. Scale bars = 10 μM.
Comment in
- Immunology. Damping by depletion.
Sakaguchi S, Wing K. Sakaguchi S, et al. Science. 2011 Apr 29;332(6029):542-3. doi: 10.1126/science.1206122. Science. 2011. PMID: 21527700 No abstract available.
Similar articles
- CTLA-4Ig: uses and future directions.
Ben-Shoshan M. Ben-Shoshan M. Recent Pat Inflamm Allergy Drug Discov. 2009 Jun;3(2):132-42. doi: 10.2174/187221309788489760. Recent Pat Inflamm Allergy Drug Discov. 2009. PMID: 19519590 - Targeting CD28, CTLA-4 and PD-L1 costimulation differentially controls immune synapses and function of human regulatory and conventional T-cells.
Dilek N, Poirier N, Hulin P, Coulon F, Mary C, Ville S, Vie H, Clémenceau B, Blancho G, Vanhove B. Dilek N, et al. PLoS One. 2013 Dec 23;8(12):e83139. doi: 10.1371/journal.pone.0083139. eCollection 2013. PLoS One. 2013. PMID: 24376655 Free PMC article. - Preferential costimulation by CD80 results in IL-10-dependent TGF-beta1(+) -adaptive regulatory T cell generation.
Perez N, Karumuthil-Melethil S, Li R, Prabhakar BS, Holterman MJ, Vasu C. Perez N, et al. J Immunol. 2008 May 15;180(10):6566-76. doi: 10.4049/jimmunol.180.10.6566. J Immunol. 2008. PMID: 18453575 Free PMC article. - Molecular and Cellular Functions of CTLA-4.
Van Coillie S, Wiernicki B, Xu J. Van Coillie S, et al. Adv Exp Med Biol. 2020;1248:7-32. doi: 10.1007/978-981-15-3266-5_2. Adv Exp Med Biol. 2020. PMID: 32185705 Review. - Targeting T cell costimulation in autoimmune disease.
Stuart RW, Racke MK. Stuart RW, et al. Expert Opin Ther Targets. 2002 Jun;6(3):275-89. doi: 10.1517/14728222.6.3.275. Expert Opin Ther Targets. 2002. PMID: 12223069 Review.
Cited by
- A systematic review of gastritis as an immune-related adverse event in clinical interventions.
Su F, Fan WX, Zhang Y, Zhang XL, Du YY, Li WL, Hu WQ, Zhao J. Su F, et al. Hum Vaccin Immunother. 2024 Dec 31;20(1):2408852. doi: 10.1080/21645515.2024.2408852. Epub 2024 Oct 21. Hum Vaccin Immunother. 2024. PMID: 39434209 Free PMC article. - Regulatory T cells in the immunodiagnosis and outcome of kidney allograft rejection.
Franzese O, Mascali A, Capria A, Castagnola V, Paganizza L, Di Daniele N. Franzese O, et al. Clin Dev Immunol. 2013;2013:852395. doi: 10.1155/2013/852395. Epub 2013 Jun 15. Clin Dev Immunol. 2013. PMID: 23843861 Free PMC article. Review. - Intragraft regulatory T cells in the modern era: what can high-dimensional methods tell us about pathways to allograft acceptance?
Bei KF, Moshkelgosha S, Liu BJ, Juvet S. Bei KF, et al. Front Immunol. 2023 Nov 23;14:1291649. doi: 10.3389/fimmu.2023.1291649. eCollection 2023. Front Immunol. 2023. PMID: 38077395 Free PMC article. Review. - The immune microenvironment in Hodgkin lymphoma: T cells, B cells, and immune checkpoints.
Vardhana S, Younes A. Vardhana S, et al. Haematologica. 2016 Jul;101(7):794-802. doi: 10.3324/haematol.2015.132761. Haematologica. 2016. PMID: 27365459 Free PMC article. Review. - In situ vaccination by radiotherapy to improve responses to anti-CTLA-4 treatment.
Vanpouille-Box C, Pilones KA, Wennerberg E, Formenti SC, Demaria S. Vanpouille-Box C, et al. Vaccine. 2015 Dec 16;33(51):7415-7422. doi: 10.1016/j.vaccine.2015.05.105. Epub 2015 Jul 3. Vaccine. 2015. PMID: 26148880 Free PMC article. Review.
References
- Tivol EA, et al. Immunity. 1995;3:541. - PubMed
- Chambers CA, Sullivan TJ, Allison JP. Immunity. 1997;7:885. - PubMed
- Waterhouse P, et al. Science. 1995;270:985. - PubMed
- Choi JM, et al. Nat Med. 2006 May;12:574. - PubMed
Publication types
MeSH terms
Substances
Grants and funding
- BB/H013598/1/BB_/Biotechnology and Biological Sciences Research Council/United Kingdom
- 17851/ARC_/Arthritis Research UK/United Kingdom
- G0400931/MRC_/Medical Research Council/United Kingdom
- BB/D011000/1/BB_/Biotechnology and Biological Sciences Research Council/United Kingdom
- G0401620/MRC_/Medical Research Council/United Kingdom
- G0802382/MRC_/Medical Research Council/United Kingdom
- G9818340/MRC_/Medical Research Council/United Kingdom
- WT_/Wellcome Trust/United Kingdom
LinkOut - more resources
Full Text Sources
Other Literature Sources
Molecular Biology Databases


