An improved cerulean fluorescent protein with enhanced brightness and reduced reversible photoswitching - PubMed (original) (raw)
An improved cerulean fluorescent protein with enhanced brightness and reduced reversible photoswitching
Michele L Markwardt et al. PLoS One. 2011.
Abstract
Cyan fluorescent proteins (CFPs), such as Cerulean, are widely used as donor fluorophores in Förster resonance energy transfer (FRET) experiments. Nonetheless, the most widely used variants suffer from drawbacks that include low quantum yields and unstable flurorescence. To improve the fluorescence properties of Cerulean, we used the X-ray structure to rationally target specific amino acids for optimization by site-directed mutagenesis. Optimization of residues in strands 7 and 8 of the β-barrel improved the quantum yield of Cerulean from 0.48 to 0.60. Further optimization by incorporating the wild-type T65S mutation in the chromophore improved the quantum yield to 0.87. This variant, mCerulean3, is 20% brighter and shows greatly reduced fluorescence photoswitching behavior compared to the recently described mTurquoise fluorescent protein in vitro and in living cells. The fluorescence lifetime of mCerulean3 also fits to a single exponential time constant, making mCerulean3 a suitable choice for fluorescence lifetime microscopy experiments. Furthermore, inclusion of mCerulean3 in a fusion protein with mVenus produced FRET ratios with less variance than mTurquoise-containing fusions in living cells. Thus, mCerulean3 is a bright, photostable cyan fluorescent protein which possesses several characteristics that are highly desirable for FRET experiments.
Conflict of interest statement
Competing Interests: The mutant CFPs described in this article are the topic of a pending patent application from the University of Maryland, Baltimore titled "Fluorescent Proteins and Uses Thereof" (SN 61/249,712). This patent covers the mutations used to derive mCerulean2 and mCerulean2.N variants that are the precursors to mCerulean3. Although the authors are pursuing commercial licensing and sale of their CFP reagents through companies like Clontech and Life Technologies, this does not alter their acceptance and adherence to the PLoS ONE policy as well as National Institutes of Health (NIH) policy for reagent sharing. All reagents described in the article are freely available upon reasonable request for the purpose of academic, non-commercial research, which will likely include deposition of the plasmids encoding mCerulean3 in a repository such as addgene.org.
Figures
Figure 1. Optimization of Cerulean.
A site-directed mutagenesis strategy was employed to optimize Cerulean fluorescence. (A) Residues on β-strand 7 (S147, D148; red), β-strand 8 (L166, I167, R168, H169; green) in the Cerulean X-ray structure (2wso.pdb [27]) were targeted for optimization by site-directed mutagenesis. The chromophore is colored blue. (B) T203 (orange) was targeted for optimization due to its proximity to the chromophore. T65 (green) was also mutated.
Figure 2. Spectral properties of new CFPs.
Absorption (dashed lines) and emission spectra (solid lines) are shown for Cerulean (black), mCerulean2 (green), mCerulean2.N (red), and mCerulean3 (blue). Spectra were normalized to the peak absorption or emission values.
Figure 3. Photostability of recombinant CFPs.
Agarose beads labeled with CFPs as indicated were imaged at 60 s intervals under low power illumination (45 µW/cm2). At 5 min, the beads were continuously illuminated for 60 s (red bar). (A) Representative images from the experimental data set are shown in pseudocolor to represent bead intensity. The scale bar indicates 10 µm. (B) Bead fluorescence was normalized to prebleached intensity and plotted versus time. Bars indicate SD (n>15 for all samples). (C) The reversible (white) and irreversible (blue) bleached fractions were quantified over the 20 min recovery period.
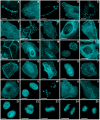
Figure 4. Fluorescence imaging of mCerulean3 fusion vectors.
Images were recorded in widefield or laser scanning confocal fluorescence microscopy. (A–M) Fusions to the N-terminus of mCerulean3; for each fusion protein the linker amino acid (aa) length is indicated after the name of the targeted organelle or fusion protein. The origin of the targeting cDNA is indicated in parenthesis. (A) mCerulean3-Cx43-7 (rat); (B) mCerulean3-EB3-7 (human microtubule-associated protein; RP/EB family); (C) mCerulean3-Golgi-7 (N-terminal 81 aa of human β-1,4-galactosyltransferase); (D) mCerulean3-α-actinin (human); (E) mCerulean3-PMP-10 (human peroxisomal membrane protein 2); (F) mCerulean3-c-src-7 (chicken c-src tyrosine kinase); (G) mCerulean3-mitochondria-7 (human cytochrome C oxidase subunit VIII); (H) mCerulean3-zyxin-7 (human); (I) mCerulean3-vimentin-7 (human); (J) mCerulean3-lifeact-7 (N-terminal 17 aa from S. cerevisiae Abp 140); (K) mCerulean3-VE-Cadherin-10 (human vascular epithelial cadherin); (L) mCerulean3-fascin-10 (human fascin); (M) mCerulean3-lysosomes-20 (human lysosomal membrane glycoprotein 1; LAMP-1). (N–Y) Fusions to the C-terminus of mCerulean3. (N) mCerulean3-lamin B1-10 (human); (O) mCerulean-MAP4-10 (mouse microtubule associated protein 4, nucleotides 1918–3135); (P) mCerulean3-lc-myosin-10 (mouse myosin light chain 9); (Q) mCerulean3-CDC42-10 (human cell division cycle 42); (R) mCerulean3-α-tubulin-6 (human); (S) mCerulean3-PCNA-19 (human proliferating cell nuclear antigen); (T) mCerulean3-profilin-10 (mouse profilin); (U) mCerulean3-clathrin light chain-15 (human); (V) mCerulean3-CAF1-10 (mouse chromatin assembly factor 1); (W) mCerulean3-fibrillarin-7 (human fibrillarin); (X) mCerulean3-β-actin-7 (human); (Y) mCerulean-Rab5a-7 (human GTPase Rab5a). (Z1–Z5) mCerulean3-H2B-6 (human) illustrating the various phases of mitosis. (Z1) interphase; (Z2) prophase; (Z3) metaphase; (Z4) anaphase; (Z5) early telophase. Scale bars indicate 10 µm.
Figure 5. Fluorescence photoswitching behavior of CFPs in living cells.
COS7 cells expressing the indicated CFP were examined by widefield microscopy. Cells were bleached to 50% of their initial fluorescence by continuous, high intensity illumination of the full field of view. Recovery of cellular fluorescence was examined 15 min following the bleaching period. Data indicates the mean % recovery of bleached fluorescence after 15 min (n = 20, two-tailed t-test, difference from 0, *** indicates P<0.001, mCerulean3 recovery was not statistically significant (ns) under the same test,P = 0.09, n = 20).
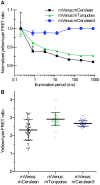
Figure 6. Improved FRET ratio imaging with mCerulean3.
(A) To test the dependence of measured FRET ratios on illumination time, agarose beads were labeled with equivalent concentrations of the indicated CFP:mVenus fusion protein. Beads were imaged consecutively using constant illumination intensity (455 nm LED, 600 µW/cm2), but a varied illumination period. Cyan and yellow fluorescence were captured simultaneously using an Optical Insights Dual-View containing standard CFP/YFP filter sets. FRET ratios were normalized to the peak FRET ratio. Points indicate the mean and error bars indicate SEM (n = 10). (B) HEK293 cells were transfected with the indicated fusion, and observed by fluorescence microscopy. The yellow/cyan FRET ratio of individual cells is shown (n = 50). Bar indicates the mean, and error bars indicate SD.
Similar articles
- Newly engineered cyan fluorescent proteins with enhanced performances for live cell FRET imaging.
Mérola F, Fredj A, Betolngar DB, Ziegler C, Erard M, Pasquier H. Mérola F, et al. Biotechnol J. 2014 Feb;9(2):180-91. doi: 10.1002/biot.201300198. Epub 2013 Dec 19. Biotechnol J. 2014. PMID: 24357633 Review. - The single T65S mutation generates brighter cyan fluorescent proteins with increased photostability and pH insensitivity.
Fredj A, Pasquier H, Demachy I, Jonasson G, Levy B, Derrien V, Bousmah Y, Manoussaris G, Wien F, Ridard J, Erard M, Merola F. Fredj A, et al. PLoS One. 2012;7(11):e49149. doi: 10.1371/journal.pone.0049149. Epub 2012 Nov 2. PLoS One. 2012. PMID: 23133673 Free PMC article. - An improved cyan fluorescent protein variant useful for FRET.
Rizzo MA, Springer GH, Granada B, Piston DW. Rizzo MA, et al. Nat Biotechnol. 2004 Apr;22(4):445-9. doi: 10.1038/nbt945. Epub 2004 Feb 29. Nat Biotechnol. 2004. PMID: 14990965 - Cyan and yellow super fluorescent proteins with improved brightness, protein folding, and FRET Förster radius.
Kremers GJ, Goedhart J, van Munster EB, Gadella TW Jr. Kremers GJ, et al. Biochemistry. 2006 May 30;45(21):6570-80. doi: 10.1021/bi0516273. Biochemistry. 2006. PMID: 16716067 - Recent advances using green and red fluorescent protein variants.
Müller-Taubenberger A, Anderson KI. Müller-Taubenberger A, et al. Appl Microbiol Biotechnol. 2007 Nov;77(1):1-12. doi: 10.1007/s00253-007-1131-5. Epub 2007 Aug 18. Appl Microbiol Biotechnol. 2007. PMID: 17704916 Review.
Cited by
- A bright monomeric green fluorescent protein derived from Branchiostoma lanceolatum.
Shaner NC, Lambert GG, Chammas A, Ni Y, Cranfill PJ, Baird MA, Sell BR, Allen JR, Day RN, Israelsson M, Davidson MW, Wang J. Shaner NC, et al. Nat Methods. 2013 May;10(5):407-9. doi: 10.1038/nmeth.2413. Epub 2013 Mar 24. Nat Methods. 2013. PMID: 23524392 Free PMC article. - Rational Design of Bioavailable Photosensitizers for Manipulation and Imaging of Biological Systems.
Binns TC, Ayala AX, Grimm JB, Tkachuk AN, Castillon GA, Phan S, Zhang L, Brown TA, Liu Z, Adams SR, Ellisman MH, Koyama M, Lavis LD. Binns TC, et al. Cell Chem Biol. 2020 Aug 20;27(8):1063-1072.e7. doi: 10.1016/j.chembiol.2020.07.001. Epub 2020 Jul 21. Cell Chem Biol. 2020. PMID: 32698018 Free PMC article. - The 1.6 Å resolution structure of a FRET-optimized Cerulean fluorescent protein.
Watkins JL, Kim H, Markwardt ML, Chen L, Fromme R, Rizzo MA, Wachter RM. Watkins JL, et al. Acta Crystallogr D Biol Crystallogr. 2013 May;69(Pt 5):767-73. doi: 10.1107/S0907444913001546. Epub 2013 Apr 11. Acta Crystallogr D Biol Crystallogr. 2013. PMID: 23633585 Free PMC article. - Layer 1 of somatosensory cortex: an important site for input to a tiny cortical compartment.
Ledderose JMT, Zolnik TA, Toumazou M, Trimbuch T, Rosenmund C, Eickholt BJ, Jaeger D, Larkum ME, Sachdev RNS. Ledderose JMT, et al. Cereb Cortex. 2023 Nov 27;33(23):11354-11372. doi: 10.1093/cercor/bhad371. Cereb Cortex. 2023. PMID: 37851709 Free PMC article. - Complex Photochemistry within the Green-Absorbing Channelrhodopsin ReaChR.
Krause BS, Grimm C, Kaufmann JCD, Schneider F, Sakmar TP, Bartl FJ, Hegemann P. Krause BS, et al. Biophys J. 2017 Mar 28;112(6):1166-1175. doi: 10.1016/j.bpj.2017.02.001. Biophys J. 2017. PMID: 28355544 Free PMC article.
References
- Shaner NC, Steinbach PA, Tsien RY. A guide to choosing fluorescent proteins. Nat Methods. 2005;2:905–909. - PubMed
- Ai HW, Shaner N, Cheng Z, Tsien R, Campbell R. Exploration of new chromophore structures leads to the identification of improved blue fluorescent proteins. Biochemistry. 2007;46:5904–5910. - PubMed
- Nagai T, Ibata K, Park ES, Kubota M, Mikoshiba K, et al. A variant of yellow fluorescent protein with fast and efficient maturation for cell-biological applications. Nat Biotechnol. 2002;20:87–90. - PubMed
- Rizzo MA, Springer G, Segawa K, Zipfel WR, Piston DW. Optimization of pairings and detection conditions for measurement of FRET between cyan and yellow fluorescent proteins. Microsc Microanal. 2006;12:238–254. - PubMed
Publication types
MeSH terms
Substances
Grants and funding
- P30 DK079637/DK/NIDDK NIH HHS/United States
- DK077140-02S1/DK/NIDDK NIH HHS/United States
- P20 GM072048/GM/NIGMS NIH HHS/United States
- DK47301-15S2/DK/NIDDK NIH HHS/United States
- R01 DK077140/DK/NIDDK NIH HHS/United States
- DK077140/DK/NIDDK NIH HHS/United States
- GM72048/GM/NIGMS NIH HHS/United States
- DK47301/DK/NIDDK NIH HHS/United States
LinkOut - more resources
Full Text Sources
Other Literature Sources
Research Materials


