Activated microglia proliferate at neurites of mutant huntingtin-expressing neurons - PubMed (original) (raw)
Activated microglia proliferate at neurites of mutant huntingtin-expressing neurons
Andrew D Kraft et al. Neurobiol Aging. 2012 Mar.
Abstract
In Huntington's disease (HD), mutated huntingtin (mhtt) causes striatal neurodegeneration which is paralleled by elevated microglia cell numbers. In vitro corticostriatal slice and primary neuronal culture models, in which neuronal expression of mhtt fragments drives HD-like neurotoxicity, were employed to examine wild type microglia during both the initiation and progression of neuronal pathology. As neuronal pathology progressed, microglia initially localized in the vicinity of neurons expressing mhtt fragments increased in number, demonstrated morphological evidence of activation, and expressed the proliferation marker, Ki67. These microglia were positioned along irregular neurites, but did not localize with mhtt inclusions nor exacerbate mhtt fragment-induced neurotoxicity. Prior to neuronal pathology, microglia upregulated ionized calcium binding adaptor molecule 1 (Iba1), signaling a functional shift. With neurodegeneration, interleukin-6 and complement component 1q were increased. The results suggest a stimulatory, proliferative signal for microglia present at the onset of mhtt fragment-induced neurodegeneration. Thus, microglia effect a localized inflammatory response to neuronal mhtt expression that may serve to direct microglial removal of dysfunctional neurites or aberrant synapses, as is required for reparative actions in vivo.
Published by Elsevier Inc.
Figures
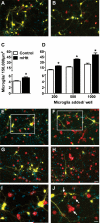
Figure 1. An elevated number of microglia are present after culture with mHtt-expressing neurons
(A-B) Staining for microglia (Iba1, red) around striatal neurons (yellow, DAPI nuclear counterstain in blue) transfected with control DNA (A) or mHtt DNA (B) in composite cortico-striatal cultures. (C) Iba1 cell counts seven days after transfection with control or mHtt DNA (*p<0.05). (D) Exogenous microglia were added to the composite cultures on the same day as transfection with control or mHtt DNA and microglia counted at 7DIV (*p<0.05). (E-J) Microglial staining around striatal neurons transfected with control DNA (E,G, and I) or mHtt DNA (F,H, and J) and cultured with varying concentrations of exogenously-added microglia: 500 in E-F and 1000 in G-H (scale= 50μm). I and J: higher magnification images of boxes inset in E and F, respectively, to show microglial interactions at neurites and mHtt+ neuronal blebs (arrows; scale= 25μm). Small, YFP-negative, DAPI-positive nuclei are co-cultured cortical neurons and non-transfected striatal neurons. Composite images of the individual fluorochromes (YFP, Iba1, CFP, and DAPI) for E-H are shown in Supplementary Fig. 2.
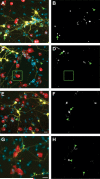
Figure 2. Proliferative microglia are present in greater numbers around neurons expressing mhtt fragments
Representative images of microglia (blue, Iba1) and YFP+, transfected striatal neurons (yellow) in control (A, C) and mHtt- transfected (B, D), composite cortico- striatal cultures immunostained for the proliferation marker, Ki67 (red; arrows indicate Iba1 and Ki67 colocalization) at 7DIV. (C-D) 1000 exogenous microglia/ well were added to cultures at transfection (scale= 25μm).
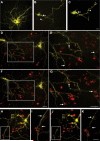
Figure 3. Transplanted microglia associate with neuronal processes at locations devoid of EM48+ aggregates of mhtt
Seven days following the addition of various concentrations of exogenous microglia to composite cortico-striatal cultures (200 in A-B; 500 in C-D and G-H; and 1000 in E-F; scale= 20μm), the association of striatal neurons expressing mHtt (yellow) with Iba1-labeled microglia (red) and EM48-labeled mHtt aggregates (white in B,D,F, and H; corresponds with panels on left) in the neuropil (arrowheads) and somata (arrows) is represented. The boxed region highlights microglia- neurite contact in the absence of nearby aggregates. DAPI nuclear staining is shown in blue. (G-H) Smaller process aggregates were assessed at higher magnification (scale= 25μm).
Figure 4. Microglia added after neuronal transfection with mHtt are associated with neurites throughout degeneration
Representative images of control neurons at 72h post-biolistic transfection (A) compared with neurons transfected with mHtt at 24h (B) and 48h (C) in dissociated cortical neuronal cultures (scale= 25μm). mHtt fragments (CFP, green) within neurites proximal (arrows in B-C) and distal (arrowheads) to the cell body. Time-lapse images of neurons expressing mHtt (yellow) and microglia exogenously- added at 2h post-transfection (IB4, red) after 24h (D) and 48h (F; scale= 50μm). Arrows highlight the appearance of microglia at the terminal ends of processes, locations where connections are remodeled, or at process intersections (E and G: higher magnification image of inset in D and F, respectively; scale= 50μm). Time-lapse image of mHtt neurons at 48h (H), and 72h (J; scale= 25μm). Arrows show smooth neurites which microglia interact with that subsequently become stippled and degenerate (I and K: higher magnification image of inset in H and J, respectively; scale= 25μm).
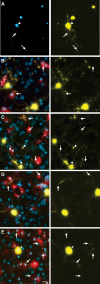
Figure 5. Endogenous slice microglia associate with processes of striatal neurons in greater numbers following transfection with mHtt, but appear to do so independently of mhtt aggregation
(A)Representative images of striatal neurons in slices transfected with mhtt plasmids encoding HttN90Q73-CFP (mHtt; blue) and YFP (yellow) after 5DIV reveal CFP+ aggregates in degenerating neurites (arrows) and the neuronal soma (arrowheads). Representative IB4 staining for microglia (red) at 3DIV (B-C) and 5DIV (D-E) in slice cultures transfected with control plasmids (B and D) or mHtt plasmids (C and E). YFP alone is shown at right (yellow) to display fine processes of transfected neurons and show microglial association with striatal neurites (arrows). (C and E) mHtt aggregates (arrowheads) indicated by CFP fluorescence (white) in mHtt-transfected cultures (scale= 25μm).
Figure 6. Microglia cell numbers are elevated in the vicinity of mhtt fragment-expressing neurons, but their distribution in relation to the cell soma remains constant
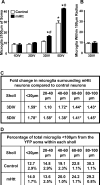
(A) IB +4 cells in cryosections from control and mHtt- transfected slice cultures were quantified within a 100μm radius of transformed striatal neuron somata over DIV. Values are given per neuron analyzed and are averaged across animal (n=3-4 rats; neurons analyzed in control and mHtt cultures, respectively: 13 and 16 at 1DIV; 32 and 34 at 2DIV; 26 and 33 at 3DIV; and 28 and 20 at 5DIV; *p<0.05 from 1DIV counts in control cultures or #p<0.05 from DIV-matched control cultures). (**B**) IB +4 cells were quantified within random regions encompassing a 100μm radius of the striatum and >250μm of any visible YFP signal in control and mHtt- transfected slice cultures. Values are given per region analyzed and are averaged across animal (12 neuron-free regions analyzed in the striatum of n=3 rats). (C) Sholl-like analysis of microglial distribution around transfected neurons showing fold changes in microglia cell number per region in mHtt-transformed cultures at 3 and 5DIV compared to control cultures (*p<0.05 from sholl and DIV-matched controls). (D) Taking the total number of microglia within 100μm of neuronal somata as 100%, the median percentage across 1, 2, 3, and 5DIV (± range) of those microglia found within each of the distance-defined sholl regions is shown for control and mHtt- transfected cultures.
Figure 7. Microglia cell numbers in mHtt- transfected cultures are enhanced by proliferation
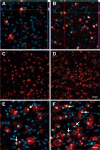
Representative images of striatal cryosections from 3DIV (A-B) and 5DIV (C-F) slice cultures transfected with control plasmids (A,C, and E) or mHtt plasmids (B,D, and F) stained for Iba1 (red), Ki67 (green), and DAPI (blue). (A-B) Orthogonal views show nuclear Ki67 within Iba1+ microglia counterstained with DAPI. (C-D) Iba1 and Ki67 fluorescence in the absence of DAPI counterstain (scale= 50μm). (E-F) Arrows indicate proliferative microglia (scale= 20μm).
Figure 8. Markers associated with microglial activity are altered following expression of mHtt in slice cultures
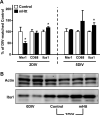
(A) qPCR for various markers common to microglia were analyzed in the striatum of 2DIV and 5DIV control and mHtt- transfected slices. Values are corrected to Rpl32 housekeeping gene expression and displayed according to their % change from DIV- matched control values (n=3 independent pools of 5 slices from an individual animal; *p<0.05). (B) Western blotting for the housekeeping protein, β-Actin (Actin), and Iba1 in slices harvested immediately after preparation (no biolistic transfection; 0DIV); in slices 3DIV after culture preparation and transfection with control plasmids (Control 3DIV); and in slices 3DIV after transfection with mHtt plasmids (mHtt 3DIV).
Figure 9. Microglia assume a more amoeboid phenotype when surrounding striatal neurons expressing mhtt fragments than when surrounding control neurons
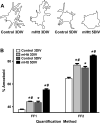
(A) Camera lucida drawings of microglia representing the median morphology of microglia quantified within a 100μm radius of striatal neurons transfected with control or mHtt plasmids at 3 and 5DIV. (B) Quantification of microglia morphology (within a 100μm radius of transfected neurons) by the FF1 or FF2 method at 3 and 5DIV around control or mHtt-expressing neurons (*p<0.05 from microglia in 3DIV control cultures; #p<0.05 from DIV-matched controls; at 3 and 5DIV, respectively: 187 and 440 microglia were evaluated in control cultures and 338 and 331 microglia in mHtt- transfected cultures).
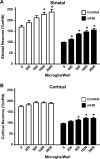
Figure 10. Microglia are neuroprotective to composite cortico-striatal neuronal cultures
(A) Numbers of striatal neurons surviving after incubation with increasing amounts of exogenously-added microglia in cultures transfected with either control DNA or mHtt DNA. (B) Numbers of cortical neurons surviving in cultures transfected with control DNA or mHtt DNA following incubation with exogenous microglia. Striatal and cortical cell numbers were normalized to the mHtt condition, set to 100%, and represent the average of 7 independent experiments. *p<0.05 from the 0 microglia condition (n=6-8).
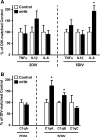
Figure 11. Neuronal mHtt expression reconfigures the molecular profile of striatal slices, resulting in increased IL-6 and C1q expression
(A) qPCR for select cytokines in the striatum of 2DIV and 5DIV cultures transfected with control or mHtt DNA. (B) qPCR for complement component 1q (C1q) components at 2DIV and 5DIV. Values are corrected to Rpl32 housekeeping gene expression and displayed according to their % change from DIV-matched control cultures (n=3 independent pools of 5 slices from an individual animal; *p<0.05).
Similar articles
- Progressive and selective striatal degeneration in primary neuronal cultures using lentiviral vector coding for a mutant huntingtin fragment.
Zala D, Benchoua A, Brouillet E, Perrin V, Gaillard MC, Zurn AD, Aebischer P, Déglon N. Zala D, et al. Neurobiol Dis. 2005 Dec;20(3):785-98. doi: 10.1016/j.nbd.2005.05.017. Epub 2005 Jul 11. Neurobiol Dis. 2005. PMID: 16006135 - Neuronal targets for reducing mutant huntingtin expression to ameliorate disease in a mouse model of Huntington's disease.
Wang N, Gray M, Lu XH, Cantle JP, Holley SM, Greiner E, Gu X, Shirasaki D, Cepeda C, Li Y, Dong H, Levine MS, Yang XW. Wang N, et al. Nat Med. 2014 May;20(5):536-41. doi: 10.1038/nm.3514. Epub 2014 Apr 28. Nat Med. 2014. PMID: 24784230 Free PMC article. - Mutant Huntingtin promotes autonomous microglia activation via myeloid lineage-determining factors.
Crotti A, Benner C, Kerman BE, Gosselin D, Lagier-Tourenne C, Zuccato C, Cattaneo E, Gage FH, Cleveland DW, Glass CK. Crotti A, et al. Nat Neurosci. 2014 Apr;17(4):513-21. doi: 10.1038/nn.3668. Epub 2014 Mar 2. Nat Neurosci. 2014. PMID: 24584051 Free PMC article. - Genetic manipulations of mutant huntingtin in mice: new insights into Huntington's disease pathogenesis.
Lee CY, Cantle JP, Yang XW. Lee CY, et al. FEBS J. 2013 Sep;280(18):4382-94. doi: 10.1111/febs.12418. Epub 2013 Jul 31. FEBS J. 2013. PMID: 23829302 Free PMC article. Review. - Nature and cause of mitochondrial dysfunction in Huntington's disease: focusing on huntingtin and the striatum.
Oliveira JM. Oliveira JM. J Neurochem. 2010 Jul;114(1):1-12. doi: 10.1111/j.1471-4159.2010.06741.x. Epub 2010 Apr 9. J Neurochem. 2010. PMID: 20403078 Review.
Cited by
- Frequency of nuclear mutant huntingtin inclusion formation in neurons and glia is cell-type-specific.
Jansen AH, van Hal M, Op den Kelder IC, Meier RT, de Ruiter AA, Schut MH, Smith DL, Grit C, Brouwer N, Kamphuis W, Boddeke HW, den Dunnen WF, van Roon WM, Bates GP, Hol EM, Reits EA. Jansen AH, et al. Glia. 2017 Jan;65(1):50-61. doi: 10.1002/glia.23050. Epub 2016 Sep 12. Glia. 2017. PMID: 27615381 Free PMC article. - A selective inhibitor of the NLRP3 inflammasome as a potential therapeutic approach for neuroprotection in a transgenic mouse model of Huntington's disease.
Chen KP, Hua KF, Tsai FT, Lin TY, Cheng CY, Yang DI, Hsu HT, Ju TC. Chen KP, et al. J Neuroinflammation. 2022 Feb 26;19(1):56. doi: 10.1186/s12974-022-02419-9. J Neuroinflammation. 2022. PMID: 35219323 Free PMC article. - Cell-Autonomous and Non-cell-Autonomous Pathogenic Mechanisms in Huntington's Disease: Insights from In Vitro and In Vivo Models.
Creus-Muncunill J, Ehrlich ME. Creus-Muncunill J, et al. Neurotherapeutics. 2019 Oct;16(4):957-978. doi: 10.1007/s13311-019-00782-9. Neurotherapeutics. 2019. PMID: 31529216 Free PMC article. Review. - Cyclic GMP-AMP synthase promotes the inflammatory and autophagy responses in Huntington disease.
Sharma M, Rajendrarao S, Shahani N, Ramírez-Jarquín UN, Subramaniam S. Sharma M, et al. Proc Natl Acad Sci U S A. 2020 Jul 7;117(27):15989-15999. doi: 10.1073/pnas.2002144117. Epub 2020 Jun 24. Proc Natl Acad Sci U S A. 2020. PMID: 32581130 Free PMC article. - Nicotinamide Adenine Dinucleotide Phosphate Oxidases Are Everywhere in Brain Disease, but Not in Huntington's Disease?
Villegas L, Nørremølle A, Freude K, Vilhardt F. Villegas L, et al. Front Aging Neurosci. 2021 Nov 5;13:736734. doi: 10.3389/fnagi.2021.736734. eCollection 2021. Front Aging Neurosci. 2021. PMID: 34803655 Free PMC article. Review.
References
- Albin RL, Young AB, Penney JB, Handelin B, Balfour R, Anderson KD, Markel DS, Tourtellotte WW, Reiner A. Abnormalities of striatal projection neurons and N-methyl-D-aspartate receptors in presymptomatic Huntington's disease. N Engl J Med. 1990;322:1293–8. - PubMed
- Arrasate M, Mitra S, Schweitzer ES, Segal MR, Finkbeiner S. Inclusion body formation reduces levels of mutant huntingtin and the risk of neuronal death. Nature. 2004;431:805–10. - PubMed
- Bjorkqvist M, Wild EJ, Thiele J, Silvestroni A, Andre R, Lahiri N, Raibon E, Lee RV, Benn CL, Soulet D, Magnusson A, Woodman B, Landles C, Pouladi MA, Hayden MR, Khalili-Shirazi A, Lowdell MW, Brundin P, Bates GP, Leavitt BR, Moller T, Tabrizi SJ. A novel pathogenic pathway of immune activation detectable before clinical onset in Huntington's disease. J Exp Med. 2008;205:1869–77. - PMC - PubMed
- Blinzinger K, Kreutzberg G. Displacement of synaptic terminals from regenerating motoneurons by microglial cells. Z Zellforsch Mikrosk Anat. 1968;85:145–57. - PubMed
Publication types
MeSH terms
Substances
Grants and funding
- F31 ES021164/ES/NIEHS NIH HHS/United States
- ZIA ES021164-14/Intramural NIH HHS/United States
- Z01 ES021164/Intramural NIH HHS/United States
- Z01 ES021164-12/Intramural NIH HHS/United States
- ES021164/ES/NIEHS NIH HHS/United States
- ZIA ES101623-07/Intramural NIH HHS/United States
- Z01 ES101623/Intramural NIH HHS/United States
- ZIA ES021164-13/Intramural NIH HHS/United States
- ZIA ES101623-08/Intramural NIH HHS/United States
- ES101623/ES/NIEHS NIH HHS/United States
LinkOut - more resources
Full Text Sources
Other Literature Sources
Medical
Research Materials
