Myosin IIA/IIB restrict adhesive and protrusive signaling to generate front-back polarity in migrating cells - PubMed (original) (raw)
Myosin IIA/IIB restrict adhesive and protrusive signaling to generate front-back polarity in migrating cells
Miguel Vicente-Manzanares et al. J Cell Biol. 2011.
Abstract
Migratory front-back polarity emerges from the cooperative effect of myosin IIA (MIIA) and IIB (MIIB) on adhesive signaling. We demonstrate here that, during polarization, MIIA and MIIB coordinately promote localized actomyosin bundling, which generates large, stable adhesions that do not signal to Rac and thereby form the cell rear. MIIA formed dynamic actomyosin proto-bundles that mark the cell rear during spreading; it also bound to actin filament bundles associated with initial adhesion maturation in protrusions. Subsequent incorporation of MIIB stabilized the adhesions and actomyosin filaments with which it associated and formed a stable, extended rear. These adhesions did not turn over and no longer signal to Rac. Microtubules fine-tuned the polarity by positioning the front opposite the MIIA/MIIB-specified rear. Decreased Rac signaling in the vicinity of the MIIA/MIIB-stabilized proto-bundles and adhesions was accompanied by the loss of Rac guanine nucleotide exchange factor (GEFs), like βPIX and DOCK180, and by inhibited phosphorylation of key residues on adhesion proteins that recruit and activate Rac GEFs. These observations lead to a model for front-back polarity through local GEF depletion.
Figures
Figure 1.
Localized actomyosin bundles that are generated by MIIA and stabilized by MIIB define the cellular region that forms the rear. (A) CHO.K1 cells were plated on fibronectin and allowed to attach for 10 min. The cells were then fixed and stained for phosphorylated RLC (pRLC), MIIA (using a MHCII-A antibody), MIIB (MHCII-B antibody), or F-actin (rhodamine-phalloidin). Images were captured using a confocal microscope (FV300; Olympus). Z projections are shown. Representative examples are shown of cells exhibiting an accumulation of these proteins (“proto-bundles,” marked with arrows). The asterisks mark the leading edge in the Z projection and corresponding 3D reconstruction. (B) CHO.K1 cells were plated on PLL and allowed to attach for 45 min. The cells were stained as in A, and they display similar proto-bundles (marked with arrows). Representative examples are shown. (C and D) Cells were transfected with RLC-D,D–GFP and either control (C) or MHCIIB-shRNA (D) to inhibit MIIB expression. Representative time points of their spreading on fibronectin are shown. In C, arrows point to the region of the cell initially primed by RLC-D,D to form the rear, where protrusion does not occur. The complete movie is shown in
Video 1
. In D, arrows point to clusters, or proto-bundles, denoted by the accumulation of MIIA (the only isoform present in the knockdowns, labeled with the RLC-D,D–GFP) that form and disassemble rapidly. Images were captured in TIRF mode using an inverted microscope (IX70; Olympus) coupled to a CCD camera (Retiga Exi; Qimaging). The complete movie is shown in
Video 2
. (E) CHO.K1 cells knocked down for MIIA or MIIB were transfected with wild-type RLC (control, black bars) or RLC-D,D (gray bars) coupled to GFP, adhered for 10 min to fibronectin, fixed, and quantified for presence of proto-bundles as for those shown in A. Data are the mean ± SD of three experiments (error bars) with >200 cells scored in each experiment. Bars, 10 µm.
Figure 2.
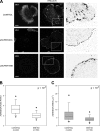
Microtubules position the leading edge across from the actomyosin-enriched rear. (A) TIRF microscopy time-lapse series of a cell expressing RLC-D,D–GFP (localized at the rear, marked by arrowheads) in the presence of the microtubule inhibitor nocodazole (5 µM). Note that the direction of movement of the leading protrusion (arrow) is bent (almost perpendicular to the major polarity axis, indicated by a dashed line), and the leading protrusion has separated from the rear; the asterisks point to the site of ripping. The complete movie is shown in
Video 3
. Bar, 10 µm. (B) Cells expressing RLC-D,D–GFP and migrating on fibronectin in the presence or absence of 5 µM nocodazole (NCD) or 0.1 µM vinblastine (VIN). Axis ratio is calculated as the ratio between long (migratory) and short (perpendicular, passing through the center of the nucleus) axes; thus, an AR of 1 (indicated with a horizontal line) denotes a round cell. Error bars indicate ±SD. (C) Diagrams showing the relative direction of the leading protrusion with respect to the axis established by the extended rear in control and 5 µM nocodazole– or 0.1 µM vinblastine–treated cells. n > 100 cells were quantified from two independent experiments.
Figure 3.
MIIB enhances MIIA-initiated actomyosin bundling in CHO.K1 cells. (A) Cells were transfected with control, MHCIIA, or MHCIIB shRNA-containing plasmids to inhibit expression of the indicated isoform. The cells were plated on 2 µg/ml fibronectin for 60 min, then fixed and stained with rhodamine-conjugated phalloidin to visualize actin (left) or antibodies against the indicated MII isoform (middle). Representative cells are shown. The right column shows inverse colored, higher magnification of the boxed regions in left column. In the MIIA-depleted cells, there are few organized actomyosin bundles; in the MIIB-depleted cells, the bundles are small and thin. Images were captured using a confocal microscope (FV300; Olympus). Bar, 10 µm. (B–D). Quantification of the actin bundling phenotypes illustrated in A. Parameters evaluated are: (B) number of bundles per cell, divided into “short” (<10 µm) and “long” (>10 µm), n ≥ 35 cells/condition; (C) bundle length, and (D) thickness (n ≥ 150 bundles from >30 cells/condition). (B–D) P is the significance using the nonparametric Mann-Whitney U test (in C and D; asterisks refer to P vs. control cells). Error bars indicate ±SD.
Figure 4.
MIIA and MIIB control different stages of adhesion maturation. (A) Cells were transfected with control, MHCIIA, or MHCIIB shRNA-containing plasmids to inhibit expression of the indicated isoform. The cells were plated on coverslips coated with 2 µg/ml fibronectin for 60 min, fixed, and stained with antibodies against the indicated MII isoform (left) or endogenous vinculin (middle). Images were captured using a confocal microscope (FV300; Olympus). Representative cells are shown. The right column shows inverse colored, higher magnification of the boxed regions in the middle column. In the MIIA-depleted cells, there are no elongated adhesions; in the MIIB-depleted cells, some adhesions around the periphery are somewhat elongated. Bar, 10 µm. (B and C) Quantification of the adhesion phenotypes including adhesion elongation represented as the axial ratio (B) and area (C). MIIA-depleted cells were not included in the analysis as they only display small, nonelongated, nascent adhesions. n is indicated, and P represents significance using the nonparametric Mann-Whitney U test.
Figure 5.
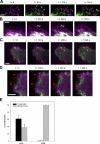
MIIB incorporates into actomyosin bundles preformed by MIIA and inhibits disassembly of actomyosin bundles and adhesions. (A) Cells were transfected with mChe-MIIA (magenta) and GFP-MIIB (green), plated on fibronectin, and filmed using TIRF microscopy. Representative time points are shown. Magenta-to-green arrowheads point to representative sites of MIIB incorporation after MIIA has created the initial bundle.
Video 4
shows the entire sequence. (B) Cells were transfected and filmed as in A. Arrows point to MIIA bundles that turn over; arrowheads point to a MIIB bundle that enlarges as MIIB incorporates into the filaments (note the magenta-to-white color transition in the bundle as it thickens, which denotes colocalization of MIIA and MIIB). (C) Cells were transfected with GFP-MIIA (green) and paxillin-mCherry (magenta), plated on fibronectin, and filmed using TIRF microscopy. Arrows in magenta point to elongated adhesions bound to MIIA-decorated actomyosin bundles that disassemble over the course of the experiment; red arrowheads point to adhesions that do not disassemble.
Video 5
shows the entire sequence. (D) Cells were transfected with GFP-MIIB (green) and paxillin-mCherry (magenta), plated on fibronectin, and filmed using TIRF microscopy. Arrowheads point to representative elongated adhesions bound to MIIB-decorated actomyosin bundles that enlarge or do not disassemble over the course of the experiment.
Video 6
shows the entire sequence. Bars, 5 µm. (E) Quantification of the adhesion turnover and maturation as shown in C and D. n = 222 adhesions/12 cells (MIIA); n = 153 adhesions/10 cells (MIIB).
Figure 6.
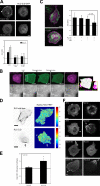
RLC-D,D restricts Rac activation and GEF localization to the front of polarized cells. (A) CHO.K1 cells were transfected with constitutively active Rac1 (myc-V12Rac1, top) or Tiam1 (HA-Tiam1 C1199, bottom) and RLC-D,D–GFP, plated onto fibronectin-coated coverslips (2 µg/ml, 60 min), stained for myc or HA, and imaged using a confocal microscope (FV300; Olympus). Representative morphologies are shown. (A, bottom) Axis ratio as defined in Fig. 2. Data are the mean ± SD of three independent experiments (error bars; n > 200). (B) CHO.K1 cells were transfected with RLC-D,D–mCherry (magenta) and mVenus-tagged PA-Rac (green), plated onto 5 µg/ml fibronectin for 15–30 min (initial phases of spreading and polarization), and photoactivated in the rear; e.g., region of RLC bundles (marked with a box). Photoactivation and imaging were done with a confocal microscope (FV1000; Olympus). Protrusion was observed by differential interference contrast to define the edge of the cell (bottom, white line). Image on the right depicts a color overlay before (green) and after (magenta) photoactivation (5 min) using mVenus fluorescence. Inset shows the detail of a fragment of the photoactivated area that displays the most robust protrusion. A representative experiment is shown. (C) CHO.K1 cells were transfected with RLC-D,D–mCherry (green) and PA-Rac (magenta), plated onto fibronectin as in Fig. 6 B, and photoactivated globally. Representative examples are on the left. (C, right) Data are the mean ± SEM (error bars) of the polarity axis scored in three independent experiments. P represents significance using a Student’s t test. (D) CHO.K1 cells were cotransfected with RLC wild type (top left) or RLC-D,D (bottom left) coupled to mCherry and the Raichu-Rac FRET sensor (right). Localized activation of Rac was visualized in a confocal microscope (FV1000) by imaging the intensity ratio image of YFP and CFP, which represents FRET efficiency. Note the lower FRET index at the rear as defined by the RLC-D,D bundles (arrows). FRET values outside of the cell contour were set to zero for representation. Note that the scales are different because of differences in expression levels and imaging parameters, resulting in differences in the absolute values of the fluorescence intensity. The arrowhead points to the region of higher Rac activity at the leading edge of the RLC-D,D cell, across from the rear. Representative cells are shown. Bar, 20 µm. (E) FRET quantification. Data are the mean ± SD (error bars) of the difference between FRET indices at the front and rear (RLC-D,D) and rear/sides (RLC-WT) from three independent experiments (RLC-D,D, n = 40; RLC-WT, n = 34). P represents significance using a Student’s t test. (F) CHO.K1 cells were transfected with wild-type RLC or RLC-D,D coupled to GFP (top) or mCherry (bottom) and mCherry-βPIX (top) or FLAG-DOCK180 (bottom), plated on fibronectin, fixed, stained with an anti-FLAG antibody (bottom), and imaged using confocal microscopy (FV300). Arrowheads point to clusters of βPIX and DOCK180, respectively, whereas arrows denote the RLC-D,D–decorated rears. Representative morphologies are shown. Bars: (A–C) 10 µm; (D and F) 20 µm.
Figure 7.
RLC-D,D–polarized cells create a region containing large adhesions with low Tyr phosphorylation at the rear and small, highly Tyr-phosphorylated, p130(Cas)-containing dynamic adhesions at the front. (A) CHO.K1 cells were transfected with wild-type RLC or RLC-D,D (fused to GFP), stained for phosphorylated Tyr118 paxillin and endogenous vinculin, and imaged with a confocal microscope (FV1000; Olympus). Arrowheads point to several clusters of pY(118)-paxillin at the leading edge; the arrow points to larger accumulations of vinculin adjacent to the RLC-D,D–decorated bundles. Representative morphologies are shown. (B) Quantification of the phosphorylation ratio using the endogenous staining pairs indicated. Data are the mean ± SD (error bars) of the ratio of the relative intensities at the front and the back (back and sides in wild-type cells). 12 cells/condition (adhesion, n > 50) were analyzed from three independent experiments. P represents significance using a Student’s t test. (C) CHO.K1 cells were transfected with wild-type RLC (top) or RLC-D,D (fused to mCherry, bottom) and GFP-p130(Cas), stained for phosphorylated Tyr(165)-p130(Cas), and imaged as in A. (D) TIRF microscopy time-lapse series of a CHO.K1 cell transfected with mGFP-dSH2 and RLC-D,D–mCherry and allowed to spread on fibronectin. Images were collected starting 5 min after plating.
Video 7
shows the entire sequence. (E) TIRF microscopy time-lapse series of a CHO.K1 cell transfected with mGFP-dSH2 and RLC-D,D–mCherry migrating on fibronectin. The cell was allowed to spread and polarize for 35 min before image collection began.
Video 8
shows the entire sequence. Bars, 10 µm.
Figure 8.
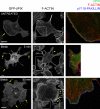
MII inhibition alters GEF localization. Cells expressing GFP-βPIX (green, right) and plated on fibronectin for 2 h were treated with 50 µM blebbistatin (Blebb) for the indicated time points, stained for actin (red) and pY118-paxillin (blue), and imaged using a confocal microscope (FV1000; Olympus). Arrowheads point to retraction defects; arrows point to the GEFs. Note the relatively even distribution of βPIX in the Blebb-treated cells. Color insets: detail (enlarged from the boxed regions) of the thin actin-rich band near the leading edge, where βPIX and paxillin phosphorylation (Y118) are more prominent. Bar, 10 µm.
Figure 9.
FAK and Src control the asymmetric distribution of adhesive signaling and actomyosin bundles to the front and rear, respectively. (A) TIRF microscopy time-lapse movie of a CHO.K1 cell expressing RLC-D,D–mCherry and mGFP-dSH2 migrating on fibronectin before and after treatment with the Src inhibitor PP2. Note the rapid disappearance of the GFP signal from the front. (B) Localization of p130(Cas) and phospho-Tyr(165) p130(Cas) in RLC-D,D–expressing cells treated with 10 µM PP2 (Src inhibitor) or 0.1 µM PF-562,271 (FAK inhibitor) imaged using a confocal microscope (FV1000; Olympus). Note the almost complete disappearance of phospho-Tyr(165) p130(Cas) in inhibited cells. Representative cells are shown. Bars, 10 µm. (C) Quantification of the axis ratio (top) and accumulation of RLC-D,D–containing bundles to the rear (bottom) in cells treated with 10 µM PP2 or 0.1 µM PF-562,271. n > 200 cells scored from three independent experiments. P represents significance using the nonparametric Mann-Whitney U test.
Similar articles
- Regulation of protrusion, adhesion dynamics, and polarity by myosins IIA and IIB in migrating cells.
Vicente-Manzanares M, Zareno J, Whitmore L, Choi CK, Horwitz AF. Vicente-Manzanares M, et al. J Cell Biol. 2007 Feb 26;176(5):573-80. doi: 10.1083/jcb.200612043. Epub 2007 Feb 20. J Cell Biol. 2007. PMID: 17312025 Free PMC article. - Segregation and activation of myosin IIB creates a rear in migrating cells.
Vicente-Manzanares M, Koach MA, Whitmore L, Lamers ML, Horwitz AF. Vicente-Manzanares M, et al. J Cell Biol. 2008 Nov 3;183(3):543-54. doi: 10.1083/jcb.200806030. Epub 2008 Oct 27. J Cell Biol. 2008. PMID: 18955554 Free PMC article. - Crawling from soft to stiff matrix polarizes the cytoskeleton and phosphoregulates myosin-II heavy chain.
Raab M, Swift J, Dingal PC, Shah P, Shin JW, Discher DE. Raab M, et al. J Cell Biol. 2012 Nov 12;199(4):669-83. doi: 10.1083/jcb.201205056. Epub 2012 Nov 5. J Cell Biol. 2012. PMID: 23128239 Free PMC article. - Rear actomyosin contractility-driven directional cell migration in three-dimensional matrices: a mechano-chemical coupling mechanism.
Chi Q, Yin T, Gregersen H, Deng X, Fan Y, Zhao J, Liao D, Wang G. Chi Q, et al. J R Soc Interface. 2014 Mar 19;11(95):20131072. doi: 10.1098/rsif.2013.1072. Print 2014 Jun 6. J R Soc Interface. 2014. PMID: 24647903 Free PMC article. Review. - Mammalian nonmuscle myosin II comes in three flavors.
Shutova MS, Svitkina TM. Shutova MS, et al. Biochem Biophys Res Commun. 2018 Nov 25;506(2):394-402. doi: 10.1016/j.bbrc.2018.03.103. Epub 2018 Mar 17. Biochem Biophys Res Commun. 2018. PMID: 29550471 Free PMC article. Review.
Cited by
- Myosin light chain kinase regulates cell polarization independently of membrane tension or Rho kinase.
Lou SS, Diz-Muñoz A, Weiner OD, Fletcher DA, Theriot JA. Lou SS, et al. J Cell Biol. 2015 Apr 27;209(2):275-88. doi: 10.1083/jcb.201409001. J Cell Biol. 2015. PMID: 25918227 Free PMC article. - Nonmuscle myosin-2: mix and match.
Heissler SM, Manstein DJ. Heissler SM, et al. Cell Mol Life Sci. 2013 Jan;70(1):1-21. doi: 10.1007/s00018-012-1002-9. Epub 2012 May 8. Cell Mol Life Sci. 2013. PMID: 22565821 Free PMC article. Review. - MYH10 activation rescues contractile defects in arrhythmogenic cardiomyopathy (ACM).
García-Quintáns N, Sacristán S, Márquez-López C, Sánchez-Ramos C, Martinez-de-Benito F, Siniscalco D, González-Guerra A, Camafeita E, Roche-Molina M, Lytvyn M, Morera D, Guillen MI, Sanguino MA, Sanz-Rosa D, Martín-Pérez D, Garcia R, Bernal JA. García-Quintáns N, et al. Nat Commun. 2023 Oct 13;14(1):6461. doi: 10.1038/s41467-023-41981-5. Nat Commun. 2023. PMID: 37833253 Free PMC article. - Actomyosin stress fiber subtypes have unique viscoelastic properties and roles in tension generation.
Lee S, Kassianidou E, Kumar S. Lee S, et al. Mol Biol Cell. 2018 Aug 8;29(16):1992-2004. doi: 10.1091/mbc.E18-02-0106. Epub 2018 Jun 21. Mol Biol Cell. 2018. PMID: 29927349 Free PMC article. - Different contributions of nonmuscle myosin IIA and IIB to the organization of stress fiber subtypes in fibroblasts.
Kuragano M, Uyeda TQP, Kamijo K, Murakami Y, Takahashi M. Kuragano M, et al. Mol Biol Cell. 2018 Apr 15;29(8):911-922. doi: 10.1091/mbc.E17-04-0215. Epub 2018 Mar 23. Mol Biol Cell. 2018. PMID: 29467250 Free PMC article.
References
- Brugnera E., Haney L., Grimsley C., Lu M., Walk S.F., Tosello-Trampont A.C., Macara I.G., Madhani H., Fink G.R., Ravichandran K.S. 2002. Unconventional Rac-GEF activity is mediated through the Dock180-ELMO complex. Nat. Cell Biol. 4:574–582 - PubMed
Publication types
MeSH terms
Substances
LinkOut - more resources
Full Text Sources
Other Literature Sources
Miscellaneous


