Genome-wide functional screen identifies a compendium of genes affecting sensitivity to tamoxifen - PubMed (original) (raw)
Genome-wide functional screen identifies a compendium of genes affecting sensitivity to tamoxifen
Ana M Mendes-Pereira et al. Proc Natl Acad Sci U S A. 2012.
Abstract
Therapies that target estrogen signaling have made a very considerable contribution to reducing mortality from breast cancer. However, resistance to tamoxifen remains a major clinical problem. Here we have used a genome-wide functional profiling approach to identify multiple genes that confer resistance or sensitivity to tamoxifen. Combining whole-genome shRNA screening with massively parallel sequencing, we have profiled the impact of more than 56,670 RNA interference reagents targeting 16,487 genes on the cellular response to tamoxifen. This screen, along with subsequent validation experiments, identifies a compendium of genes whose silencing causes tamoxifen resistance (including BAP1, CLPP, GPRC5D, NAE1, NF1, NIPBL, NSD1, RAD21, RARG, SMC3, and UBA3) and also a set of genes whose silencing causes sensitivity to this endocrine agent (C10orf72, C15orf55/NUT, EDF1, ING5, KRAS, NOC3L, PPP1R15B, RRAS2, TMPRSS2, and TPM4). Multiple individual genes, including NF1, a regulator of RAS signaling, also correlate with clinical outcome after tamoxifen treatment.
Conflict of interest statement
The authors declare no conflict of interest.
Figures
Fig. 1.
Detection of tamoxifen sensitization and resistance-causing effects. (A) Venn diagrams indicating the number of candidate hits defined by three parallel analysis methods. (B) Plot of shRNA DE Z scores ranked by size of effect. Data from nonsilencing shRNAs is highlighted, as are data from shRNA targeting PTEN or ESR1, the gene encoding ERα.
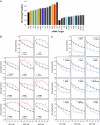
Fig. 2.
Validation of individual tamoxifen resistance- or sensitivity-causing effects. (A) Effect of siRNA on survival in 4OHT. MCF7s were transfected with siRNA duplexes in replica plates and 48 h later exposed to 1 μM 4OHT or drug vehicle. Seven days later cell viability was determined using Cell Titer Glo. Surviving fraction for each siRNA was calculated using the calculation SFgene x = luminescence in 4OHT-treated wells/luminescence in similarly transfected vehicle-treated wells. (B) Individual dose–response curves for 11 resistance-causing genes. Experimental setup was as in A but using a 4OHT titration. (C) Individual dose–response curves for 11 sensitivity-causing genes.
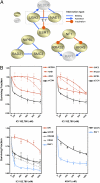
Fig. 3.
Network-associated effects. (A) Interaction diagrams for selected validated hits. In each case, the type interaction is shown. (B) ICI182,780 and 4OHT dose–response curves for selected genes.
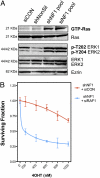
Fig. 4.
NF1 and tamoxifen response. (A) NF1 RNAi reagents that cause 4OHT resistance activate RAS and ERK in MCF7 cells treated with 4OHT. MCF7 cells were transfected with the indicated RNAi reagents and treated with 4OHT (500 nM for 24 h), after which levels of GTP-Ras and phosphorylated ERK were detected by immunoblotting. (B) Suppression of downstream RAS effector, c-RAF (RAF1), restores sensitivity to tamoxifen in MCF7s with stable NF1 knockdown. MCF7 cells were infected with NF1 shRNA and, after puromycin selection, subsequently transfected with nontargeting or RAF1 siRNAs. The response to 4OHT was then monitored using a 96-well format assay (15).
Fig. 5.
Clinical significance of genes identified in the functional screen. (A) Low NF1 expression correlates with poor outcome in tamoxifen-treated patients. Forest plot indicates log HRs for increase in NF1 expression as estimated by Cox regression. Dots represent the weighted median effect and lines the 95% confidence interval (CI) for each of the five studies considered. Log HRs refer here to the relative risk of distant relapse in relation to gene expression, whereby positive and negative values represent decreasing or increasing risk, respectively, as gene expression decreases (zero suggests no correlation between gene expression and relative risk). A global negative log HR indicates that reduced expression of NF1 correlates with a poor outcome (high risk) in tamoxifen-treated breast cancer patients. As diamond limits define CI for the overall effect, the combined effect for NF1 is significant at P < 0.05. The most significant individual study is presented as a Kaplan-Meier survival curve in
SI Appendix
,
Fig. S6
. (B) Low expression of eight resistance-causing genes identified in the functional screen correlates with poorer outcome in tamoxifen-treated patients. Genes included in this analysis were BAP1, CDK10, NF1, NIPBL, PTEN, RARG, SMC3, and UBA3. (C) Low expression of six sensitivity-causing genes identified in the functional screen correlates with a favorable outcome in tamoxifen-treated breast cancer patients. Genes included in this analysis were EDF1, KRAS, PDPK1, RAF1, TMPRSS2, and TPM4.
Similar articles
- A genome-wide RNAi screen identifies novel targets of neratinib resistance leading to identification of potential drug resistant genetic markers.
Seyhan AA, Varadarajan U, Choe S, Liu W, Ryan TE. Seyhan AA, et al. Mol Biosyst. 2012 Apr;8(5):1553-70. doi: 10.1039/c2mb05512k. Epub 2012 Mar 23. Mol Biosyst. 2012. PMID: 22446932 - Genome-wide discovery of genetic variants affecting tamoxifen sensitivity and their clinical and functional validation.
Weng L, Ziliak D, Im HK, Gamazon ER, Philips S, Nguyen AT, Desta Z, Skaar TC, Flockhart DA, Huang RS; Consortium on Breast Cancer Pharmacogenomics (COBRA). Weng L, et al. Ann Oncol. 2013 Jul;24(7):1867-1873. doi: 10.1093/annonc/mdt125. Epub 2013 Mar 18. Ann Oncol. 2013. PMID: 23508821 Free PMC article. - Tamoxifen-induced epigenetic silencing of oestrogen-regulated genes in anti-hormone resistant breast cancer.
Stone A, Valdés-Mora F, Gee JM, Farrow L, McClelland RA, Fiegl H, Dutkowski C, McCloy RA, Sutherland RL, Musgrove EA, Nicholson RI. Stone A, et al. PLoS One. 2012;7(7):e40466. doi: 10.1371/journal.pone.0040466. Epub 2012 Jul 10. PLoS One. 2012. PMID: 22808167 Free PMC article. - MUC1 induces tamoxifen resistance in estrogen receptor-positive breast cancer.
Merikhian P, Ghadirian R, Farahmand L, Mansouri S, Majidzadeh-A K. Merikhian P, et al. Expert Rev Anticancer Ther. 2017 Jul;17(7):607-613. doi: 10.1080/14737140.2017.1340837. Epub 2017 Jun 21. Expert Rev Anticancer Ther. 2017. PMID: 28597750 Review. - Crosstalk of methylation and tamoxifen in breast cancer (Review).
Shen J, He Y, Li S, Chen H. Shen J, et al. Mol Med Rep. 2024 Oct;30(4):180. doi: 10.3892/mmr.2024.13304. Epub 2024 Aug 12. Mol Med Rep. 2024. PMID: 39129315 Free PMC article. Review.
Cited by
- Unmutated RRAS2 emerges as a key oncogene in post-partum-associated triple negative breast cancer.
Cifuentes C, Oeste CL, Fernández-Pisonero I, Hortal AM, García-Macías C, Hochart J, Rubira R, Horndler L, Horndler C, Bustelo XR, Alarcón B. Cifuentes C, et al. Mol Cancer. 2024 Jul 10;23(1):142. doi: 10.1186/s12943-024-02054-3. Mol Cancer. 2024. PMID: 38987766 Free PMC article. - Essential gene profiles in breast, pancreatic, and ovarian cancer cells.
Marcotte R, Brown KR, Suarez F, Sayad A, Karamboulas K, Krzyzanowski PM, Sircoulomb F, Medrano M, Fedyshyn Y, Koh JLY, van Dyk D, Fedyshyn B, Luhova M, Brito GC, Vizeacoumar FJ, Vizeacoumar FS, Datti A, Kasimer D, Buzina A, Mero P, Misquitta C, Normand J, Haider M, Ketela T, Wrana JL, Rottapel R, Neel BG, Moffat J. Marcotte R, et al. Cancer Discov. 2012 Feb;2(2):172-189. doi: 10.1158/2159-8290.CD-11-0224. Epub 2011 Dec 29. Cancer Discov. 2012. PMID: 22585861 Free PMC article. - Systematic drug screening reveals specific vulnerabilities and co-resistance patterns in endocrine-resistant breast cancer.
Kangaspeska S, Hultsch S, Jaiswal A, Edgren H, Mpindi JP, Eldfors S, Brück O, Aittokallio T, Kallioniemi O. Kangaspeska S, et al. BMC Cancer. 2016 Jul 4;16:378. doi: 10.1186/s12885-016-2452-5. BMC Cancer. 2016. PMID: 27378269 Free PMC article. - Increased expression of the HDAC9 gene is associated with antiestrogen resistance of breast cancers.
Linares A, Assou S, Lapierre M, Thouennon E, Duraffourd C, Fromaget C, Boulahtouf A, Tian G, Ji J, Sahin O, Badia E, Boulle N, Cavaillès V. Linares A, et al. Mol Oncol. 2019 Jul;13(7):1534-1547. doi: 10.1002/1878-0261.12505. Epub 2019 Jun 12. Mol Oncol. 2019. PMID: 31099456 Free PMC article. - Constructing a novel prognostic model for triple-negative breast cancer based on genes associated with vasculogenic mimicry.
Ren Y, Feng L, Tan Z, Zhou F, Liu S. Ren Y, et al. Aging (Albany NY). 2024 May 8;16(9):8086-8109. doi: 10.18632/aging.205806. Epub 2024 May 8. Aging (Albany NY). 2024. PMID: 38728245 Free PMC article.
References
- EBCTCG Tamoxifen for early breast cancer: An overview of the randomised trials. Early Breast Cancer Trialists' Collaborative Group. Lancet. 1998;351:1451–1467. - PubMed
- Frasor J, et al. Profiling of estrogen up- and down-regulated gene expression in human breast cancer cells: Insights into gene networks and pathways underlying estrogenic control of proliferation and cell phenotype. Endocrinology. 2003;144:4562–4574. - PubMed
- Jenuwein T, Allis CD. Translating the histone code. Science. 2001;293:1074–1080. - PubMed
- Dubik D, Shiu RP. Transcriptional regulation of c-myc oncogene expression by estrogen in hormone-responsive human breast cancer cells. J Biol Chem. 1988;263:12705–12708. - PubMed
Publication types
MeSH terms
Substances
LinkOut - more resources
Full Text Sources
Other Literature Sources
Medical
Research Materials
Miscellaneous


