Reactive oxygen species production by forward and reverse electron fluxes in the mitochondrial respiratory chain - PubMed (original) (raw)
Reactive oxygen species production by forward and reverse electron fluxes in the mitochondrial respiratory chain
Vitaly A Selivanov et al. PLoS Comput Biol. 2011 Mar.
Abstract
Reactive oxygen species (ROS) produced in the mitochondrial respiratory chain (RC) are primary signals that modulate cellular adaptation to environment, and are also destructive factors that damage cells under the conditions of hypoxia/reoxygenation relevant for various systemic diseases or transplantation. The important role of ROS in cell survival requires detailed investigation of mechanism and determinants of ROS production. To perform such an investigation we extended our rule-based model of complex III in order to account for electron transport in the whole RC coupled to proton translocation, transmembrane electrochemical potential generation, TCA cycle reactions, and substrate transport to mitochondria. It fits respiratory electron fluxes measured in rat brain mitochondria fueled by succinate or pyruvate and malate, and the dynamics of NAD(+) reduction by reverse electron transport from succinate through complex I. The fitting of measured characteristics gave an insight into the mechanism of underlying processes governing the formation of free radicals that can transfer an unpaired electron to oxygen-producing superoxide and thus can initiate the generation of ROS. Our analysis revealed an association of ROS production with levels of specific radicals of individual electron transporters and their combinations in species of complexes I and III. It was found that the phenomenon of bistability, revealed previously as a property of complex III, remains valid for the whole RC. The conditions for switching to a state with a high content of free radicals in complex III were predicted based on theoretical analysis and were confirmed experimentally. These findings provide a new insight into the mechanisms of ROS production in RC.
Conflict of interest statement
The authors have declared that no competing interests exist.
Figures
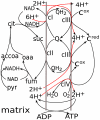
Figure 1. Scheme for mitochondrial respiration and linked processes simulated in the model.
Two reactions lead from pyruvate to succinate and further transformation to oxaloacetate reduce NAD+ to NADH. The latter is used by complex I to generate a transmembrane electrochemical proton potential (ΔμH+) and reduce ubiquinone (Q) to ubiquinol (QH2), oxidation of which by complex III also contributes to ΔμH+. Complex III reduces cytochrome c, oxidation of which by complex IV and reduction of molecular oxygen to H2O is also coupled to ΔμH+ generation. Oxidation of succinate to fumarate by complex II is coupled to the reduction of ubiquinone and thus fuels complex III. The product of electron transport, ΔμH+, is consumed for ATP synthesis.
Figure 2. Simulation of forward and reverse electron flows in the respiratory chain.
(A) NADH reduction in state 4 in the absence (st4) and presence of rotenone (+rot). Points are experimental data (−e) measured in brain mitochondria fueled by 1 mM succinate, lines are calculated (−t). (B) Reversible electron flow through complex I computed in the simulations shown in (A). (C) Respiration (net forward flux to oxygen) and (D) ΔΨ under different substrate conditions (suc, 1 mM succinate; or pyr, 1 mM malate and 1.5 mM pyruvate ). State 4 respiration (st4) was simulated using the parameters described in Methods. The action of rotenone was simulated by setting k fI5 = k rI5 = 0 (rate constants for N2–ubiquinone interactions). The maximal respiration rate (−u, uncoupled) was simulated by setting a high proton leak (k lk = 50000 s−1). Arrows denote the time of additions of mitochondria (Mt, usually at time 0), succinate (suc), and rotenone (rot) if they ate not present in the medium before mitochondria.
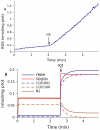
Figure 3. Effect of rotenone on ROS production in mitochondria fueled by 0.5 mM succinate.
(A) ROS production measured. (B–D) Model prediction of the content of various free radicals. The dynamics of (B) SQ bound to Qo sites of complex III, (C) SQ at Qn sites of complex I and (D) FMNH were taken from the same simulations of state 4 respiration in succinate-fueled mitochondria for rotenone addition (+rot), either initially or in the course of measurements, as in Figure 2. The simulation marked suc<->mal had a tenfold increased rate constant for this exchange. The inset in (D) shows the dynamics of N2 radicals and species 1101100 and 1101001 for rotenone addition (the digit positions correspond to Qp-Qp-Qn-Qn-N2-FMN-FMN; 1 denotes reduced and 0 oxidized). Arrows indicate the time of additions of mitochondria (Mt), succinate (suc) and rotenone (rot).
Figure 4. Effect of rotenone on ROS production in mitochondria fueled by 5 mM pyruvate and 5 mM malate.
(A) ROS production measured in state 4 respiration and the change on addition of rotenone. (B) Model prediction of free radical levels in a simulation of the conditions for (A). The model parameters are the same as for the simulation shown in Figure 2.
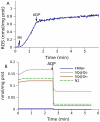
Figure 5. Effect of acceleration of electron transport on ROS production inmitochondria fueled by 3 mM succinate.
(A) ROS production measured in state 4 and the change on addition of 1 mM ADP. (B) Model prediction of free radical content. The dynamics of free radical levels in a simulation of the conditions for (A). The model parameters are the same as for the simulation shown in Figure 2.
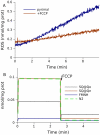
Figure 6. Effect of stimulation of electron transport on ROS production in mitochondria fueled by 5 mM pyruvate and 5 mM malate.
(A) ROS production measured in state 4 and in the presence of uncoupler FCCP. (B) Model prediction of free radical content on addition of FCCP. The model parameters are the same as for the simulation shown in Figure 2.
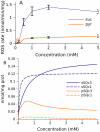
Figure 7. Substrate dependence of ROS production and levels of free radicals.
(A) ROS production measured in brain mitochondria. (B) Predicted levels of free radicals in complexes I and III. Succinate (blue curves) or pyruvate (orange) was used as substrate. Semiquinone levels in complexes I (c1) and III (c3) are presented as indicators of ROS production.
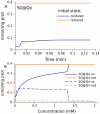
Figure 8. Bistable behavior of the respiratory chain.
(A) Predicted dynamics of semiquinones bound to the Qo site of complex III when the system is initially in an oxidized or a reduced state. Substrate concentrations: succinate 0.1 mM, pyruvate 0.25 mM. (B) Steady-state levels of semiquinones bound at the Qo site of complex III and the Qn site of complex I as a function of succinate concentration. The pyruvate concentration for the blue curve is 0.1 mM.
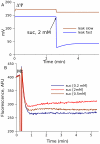
Figure 9. Decrease in ΔΨ on transition from the oxidized to the reduced state.
(A) Predicted dynamics of the transition induced by addition of 2 mM succinate to mitochondria initially in the oxidized state in the presence of 5 mM pyruvate, under the conditions of various proton leaks through the inner menbrane, slow leak, klk = 17000, and fast leak, klk = 80000 mL/(s·mg prot) (eq.H.1). (B) ΔΨ measured as safranine O fluorescence (lower values correspond to higher ΔΨ) at various succinate concentrations (as indicated). The initial levels of fluorescence (∼400 AFU) is slightly increased in the moment of addition of mitochondria and, then, energization and uptake of the dye results in decrease of fluorescence. The initial levels after the addition of mitochondria correspond to deenergized mitochondria and final corresponds to maximally energized mitochondria.
Figure 10. Interactions between N2 centers and quinones in complex I.
Numbers above or below a species indicate the redox state of the complex as a combination of electron transporters. The last two digits indicate the presence (1) or absence (0) of two valence electrons of FMN (not shown graphically). The third digit from the right denotes the state of the N2 center, the next two digits from the right indicate the presence or absence of two valence electrons of Q/Q−/QH2 at the n-site. The next two digits from the right indicate the valence electrons of Q/Q−/QH2 at the p-site. Numbers 0–8 above arrows denote individual reactions. 0, FMN reduction by NADH; 1, electron transition from FMN to the N2 center; 2, electron transition from reduced N2 to n-site ubiquinone. This interaction results in electron transfer from p-side ubiquinol to n-side semiquinone, which is coupled to binding of two protons taken from the matrix side and release of two protons to the intermembrane space. 3, ubiquinol thus produced is released and p-site semiquinone changes its position, releasing the p-site, which binds the released ubiquinol; 4, n-site semiquinone takes an electron from p-site ubiquinol and forms ubiquinol, taking two protons from the matrix, while the p-site semiquinone formed releases two protons to the p-side of the membrane. 6, ubiquinol formed at the n-site dissociates and semiquinone bound at the p-site changes its location, binding to the n-site. 7, the non-paired electron of N2 is captured by n-site semiquinone, which subsequently takes two protons from the matrix and is converted to ubiquinol. 8, release of n-site bound ubiquinol, and binding of ubiquinol at the p-site and ubiquinone at the n-site.
Similar articles
- Fatty acids decrease mitochondrial generation of reactive oxygen species at the reverse electron transport but increase it at the forward transport.
Schönfeld P, Wojtczak L. Schönfeld P, et al. Biochim Biophys Acta. 2007 Aug;1767(8):1032-40. doi: 10.1016/j.bbabio.2007.04.005. Epub 2007 May 3. Biochim Biophys Acta. 2007. PMID: 17588527 - Hysteresis and bistability in the succinate-CoQ reductase activity and reactive oxygen species production in the mitochondrial respiratory complex II.
Markevich NI, Galimova MH, Markevich LN. Markevich NI, et al. Redox Biol. 2020 Oct;37:101630. doi: 10.1016/j.redox.2020.101630. Epub 2020 Jul 5. Redox Biol. 2020. PMID: 32747163 Free PMC article. - Effects of resveratrol on the rat brain respiratory chain.
Zini R, Morin C, Bertelli A, Bertelli AA, Tillement JP. Zini R, et al. Drugs Exp Clin Res. 1999;25(2-3):87-97. Drugs Exp Clin Res. 1999. PMID: 10370869 - Molecular mechanisms of superoxide production by the mitochondrial respiratory chain.
Dröse S, Brandt U. Dröse S, et al. Adv Exp Med Biol. 2012;748:145-69. doi: 10.1007/978-1-4614-3573-0_6. Adv Exp Med Biol. 2012. PMID: 22729857 Review. - Reactive oxygen species and nitric oxide in plant mitochondria: origin and redundant regulatory systems.
Blokhina O, Fagerstedt KV. Blokhina O, et al. Physiol Plant. 2010 Apr;138(4):447-62. doi: 10.1111/j.1399-3054.2009.01340.x. Epub 2009 Dec 9. Physiol Plant. 2010. PMID: 20059731 Review.
Cited by
- Cytoskeletal Arrest: An Anoxia Tolerance Mechanism.
Myrka A, Buck L. Myrka A, et al. Metabolites. 2021 Aug 23;11(8):561. doi: 10.3390/metabo11080561. Metabolites. 2021. PMID: 34436502 Free PMC article. Review. - Intermittent hypoxia training: Powerful, non-invasive cerebroprotection against ethanol withdrawal excitotoxicity.
Jung ME, Mallet RT. Jung ME, et al. Respir Physiol Neurobiol. 2018 Oct;256:67-78. doi: 10.1016/j.resp.2017.08.007. Epub 2017 Aug 12. Respir Physiol Neurobiol. 2018. PMID: 28811138 Free PMC article. Review. - Role of Bioactive Compounds in the Regulation of Mitochondrial Dysfunctions in Brain and Age-Related Neurodegenerative Diseases.
Kessas K, Chouari Z, Ghzaiel I, Zarrouk A, Ksila M, Ghrairi T, El Midaoui A, Lizard G, Kharoubi O. Kessas K, et al. Cells. 2022 Jan 13;11(2):257. doi: 10.3390/cells11020257. Cells. 2022. PMID: 35053373 Free PMC article. Review. - The Role of Mitochondrial and Endoplasmic Reticulum Reactive Oxygen Species Production in Models of Perinatal Brain Injury.
Singh-Mallah G, Nair S, Sandberg M, Mallard C, Hagberg H. Singh-Mallah G, et al. Antioxid Redox Signal. 2019 Sep 20;31(9):643-663. doi: 10.1089/ars.2019.7779. Epub 2019 May 15. Antioxid Redox Signal. 2019. PMID: 30957515 Free PMC article. - NADPH Oxidases: From Molecular Mechanisms to Current Inhibitors.
Cipriano A, Viviano M, Feoli A, Milite C, Sarno G, Castellano S, Sbardella G. Cipriano A, et al. J Med Chem. 2023 Sep 14;66(17):11632-11655. doi: 10.1021/acs.jmedchem.3c00770. Epub 2023 Aug 31. J Med Chem. 2023. PMID: 37650225 Free PMC article. Review.
References
- Koopman WJ, Nijtmans LG, Dieteren CE, Roestenberg P, Valsecchi F, et al. Mammalian mitochondrial complex I: biogenesis, regulation, and reactive oxygen species generation. Antioxid Redox Signal. 2010;12:1431–1470. - PubMed
- McCord JM, Fridovich I. Superoxide dismutase: the first twenty years (1968–1988) (1988). Free Radic Biol Med. 5:363–369. - PubMed
- Brookes PS, Yoon Y, Robotham JL, Anders MW, Sheu SS. Calcium, ATP, and ROS: a mitochondrial love-hate triangle. Am J Physiol Cell Physiol. 2004;287:C817–C833. - PubMed
Publication types
MeSH terms
Substances
LinkOut - more resources
Full Text Sources
Other Literature Sources
