The NLR adaptor ASC/PYCARD regulates DUSP10, mitogen-activated protein kinase (MAPK), and chemokine induction independent of the inflammasome - PubMed (original) (raw)
The NLR adaptor ASC/PYCARD regulates DUSP10, mitogen-activated protein kinase (MAPK), and chemokine induction independent of the inflammasome
Debra J Taxman et al. J Biol Chem. 2011.
Abstract
ASC/PYCARD is a common adaptor for a diverse set of inflammasomes that activate caspase-1, most prominently the NLR-based inflammasome. Mounting evidence indicates that ASC and these NLRs also elicit non-overlapping functions, but the molecular basis for this difference is unclear. To address this, we performed microarray and network analysis of ASC shRNA knockdown cells. In pathogen-infected cells, an ASC-dependent interactome is centered on the mitogen-activated protein kinase (MAPK) ERK and on multiple chemokines. ASC did not affect the expression of MAPK but affected its phosphorylation by pathogens and Toll-like receptor agonists via suppression of the dual-specificity phosphatase, DUSP10/MKP5. Chemokine induction, DUSP function, and MAPK phosphorylation were independent of caspase-1 and IL-1β. MAPK activation by pathogen was abrogated in Asc(-/-) but not Nlrp3(-/-), Nlrc4(-/-), or Casp1(-/-) macrophages. These results demonstrate a function for ASC that is distinct from the inflammasome in modulating MAPK activity and chemokine expression and further identify DUSP10 as a novel ASC target.
Figures
FIGURE 1.
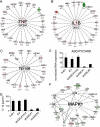
Network analysis of _Pg_-stimulated genes in control and ASC-knockdown cells. A–C, interactomes identified by Ingenuity analysis of the GeneSpring 7.0 microarray genes in
supplemental Table S3
. Values represent -fold stimulation for _Pg_-stimulated versus control THP1 cells. Positive values and red color represent increase in _Pg_-stimulated cells, while green color and negative values represent decrease. Bold lines represent physical interactions between proteins, and dotted lines represent functional interactions. A, cell to cell signaling interactome, p < 10E-46; B, cellular growth and proliferation interactome, p < 10E-46; C, gene expression interactome, p < 10E-41. D, assessment of ASC knockdown in shASC THP1 cell lines. Control cells include THP1 and THP1 expressing an empty vector (EV) or a mutated target site (shASC#1mut). ASC-knockdown cell lines, shASC#1 and -#2, encode different shRNAs for ASC. ASC expression was measured by real-time PCR and normalized to an average of 100 in control cell lines. Data represent averages ± S.D. for three independent experiments. E, IL-1β ELISA of supernatants from control and ASC-knockdown cells following Pg infection. Data represent averages ± S.D. for three independent experiments. F, Ingenuity analysis of genes differentially activated by Pg in the presence and absence of ASC. The “inflammatory and immunological disease” interactome depicted (p < 10E-42) was based on GeneSpring 7.0 microarray values from
supplemental Table S4
. Values represent -fold stimulation for _Pg_-infected shASC#1 versus shASC#1mut cells. Negative values and green color represent a decrease in shASC#1 cells, while positive values and red color represent an increase.
FIGURE 2.
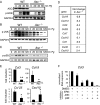
Chemokine transcription is reduced in shASC-containing THP1 cell lines. A, TNFA expression over a time course of infection with Pg. Real-time PCR values were normalized to 1 in uninfected THP1 cells. Representative of three independent experiments. B–D, expression of CCL3, CCL4, and CXCL3 as measured by real-time PCR. Data were normalized to 100 in _Pg_-induced THP1 cells. N.D., not detectable. Data represent averages ± S.D. for at least three independent experiments. E, RNA decay following DRB treatment as measured by real-time PCR. Starting values were normalized to 100. Data represent averages ± S.D. and are representative of three independent experiments. F, real-time PCR of nascent transcripts in control and shASC cells. Data were normalized to 1 in uninfected cells. Representative of three independent experiments.
FIGURE 3.
Analysis of secreted cytokine and chemokine levels in control and shASC-containing THP1 lines. A, -fold induction of cytokines and chemokines in supernatants 24 h following Pg infection. Values represent ratios of binding on RayBio® Human Cytokine Antibody Array 5 chips for 3-fold or more difference between shASC #1mut and shASC#1 cells. B–E, ELISA of TNF-α, CCL3, CCL20, and IGF-1 prior to or following 24-h infection with Pg. Data represent averages ± S.D. for at least three independent experiments.
FIGURE 4.
MAPK activation is reduced in shASC-containing THP1 cells. A, Western analysis of p-ERK, total ERK (ERK1 and ERK2), and GAPDH in shASC#1mut and shASC#1 cells following a time course of infection with Pg. Representative of at least five independent experiments. B, Western analysis of p-ERK and GAPDH in shASC#1mut and shASC#1 cells following 60-min treatment with E. coli or TLR agonist. Representative of three independent experiments. P3C, Pam3Cys-Ser-(Lys)4-trihydrochloride. C, Western analysis of p-JNK and total JNK in shASC#1mut and shASC#1 cells following a time course of infection with Pg. Representative of at least three independent experiments. D, ELISA of chemokine levels in THP1 cells treated with Pg, DMSO solvent, ERK, and/or JNK inhibitor. Data represent average ± S.D. for at least three independent experiments. N.D., not detectable. E, ELISA of IGF-1 levels in _Pg_-treated cells following addition of DMSO, ERK, or JNK inhibitor. Data represent averages ± S.D. for three independent experiments.
FIGURE 5.
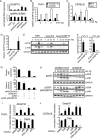
MAPK activation and chemokine induction in primary mouse macrophages is Asc-dependent. A–C, Western blot of p-ERK, p-JNK, and p-p38 in primary mouse macrophages from WT C57BL/6 and _Asc_−/− mice following a time course of infection with Pg. Blotting for the Asc protein is shown as a verification of the knockout, and GAPDH is shown as a loading control. Representative of at least three independent experiments. D, chemokines modulated in _Asc_−/− mice as assessed by pathway-focused gene expression profiling of pooled RNA from six mice. Values represent -fold expression for _Pg_-infected _Asc_−/− versus WT macrophages. Negative values represent a decrease in _Asc_−/− macrophages, and positive values represent an increase. A complete list of genes is provided in
supplemental Table S5
. E, induction of chemokines following 2-h Pg infection as assessed by TaqMan® PCR. Data represent averages ± S.D. for four independent experiments; *, p < 0.05; **, p < 0.05. F, effects of MAPK inhibitors on Ccl3 expression as determined by TaqMan® Assays. Expression levels were normalized to 100 in control cells. Data represent averages ± S.D. for three independent experiments.
FIGURE 6.
Elevated DUSP10 levels negatively regulate _Pg_-induced chemokine expression. A, real-time analysis of DUSP10 and MAPK1/ERK2 RNA in control and shASC-containing cell lines following 2-h Pg infection. Expression was normalized to 1 in THP1 cells. Representative of at least three independent experiments. B and C, real-time PCR of DUSP10 RNA over a time course of infection with Pg for (B) shASC#1mut versus shASC#1 THP1 cells and (C) WT C57BL/6 _versus Asc_−/− murine primary macrophages. Expression was normalized to 1 in uninfected control cells. Data represent averages ± S.D. for three independent experiments. D, real-time PCR of DUSP10 RNA levels in THP1, pLex-EV, and pLex-DUSP10 cells. Values were normalized to 1 in THP1 cells. Data represent average ± S.D. for three independent experiments. E, Western analysis of p-ERK and p-JNK in non-transfected THP1 cells and pLex-EV- and pLex-DUSP10-containing cells following a time course of infection with Pg. This was representative of three independent experiments. F, ELISA of CCL3 and CCL20 in supernatants from cells expressing pLex-EV or pLex-DUSP10 18 h following infection with Pg. N.D., not detectable. Data represent averages ± S.D. for three independent experiments. G, real-time PCR of ASC and DUSP10 RNA levels in single or double knockdown THP1 cells created by transduction with lentivirus expressing shASC#1 or shASC#1mut and shDUSP10 (pLKO-shDUSP10) or an empty vector (pLKO). Values were normalized to an average of 100 in control cells. Data represent average ± S.D. for three independent experiments. H, Western analysis of p-ERK and p-JNK in shASC#1mut- and shASC#1-containing THP1 cells transduced with pLKO control or pLKO-shDUSP10-expressing lentivirus. This was representative of three independent experiments. I and J, real-time PCR analysis of DUSP10 expression following pretreatment with MAPK inhibitors in THP1 cells (I) and primary mouse macrophages (J). TNFA is shown as a control. Expression was normalized to 1 in control cells. Data represent averages ± S.D. for three independent experiments; *, p < 0.05.
FIGURE 7.
Induction of chemokines and ERK phosphorylation by Pg is IL-1β-, caspase-1-, and NLRP3-independent. A, real-time PCR of chemokine RNA in THP1 cells treated with Pg and/or the IL-1 receptor antagonist, Kineret®. Data are normalized to an average of 100 in _Pg_-treated THP1 cells and represent averages ± S.D. for three independent experiments. N.D., not detectable. B, ELISA of IL-1β, CCL3, and CCL20 in supernatant from THP1 cells treated with Pg, Kineret®, and/or the caspase-1 inhibitor YVAD-cmk. C and D, Western analysis of p-ERK in THP1 cells following a time course of infection with Pg. Kineret® (C) or YVAD-cmk (D) was added as indicated. GAPDH is shown as a loading control. Representative of three independent experiments. E, caspase-1 activation in shASC#1 and pLex-DUSP10 cells following Pg infection. Immunoprecipitation/immunoblotting was performed in uninfected cells (lanes 1–4) and following 2.5-h Pg infection (lanes 5–8). An immunoblot for actin in cell lysates is shown as a loading control. Representative of three independent experiments. F–I, Western blot of p-ERK following a time course of infection with Pg in primary mouse macrophages from WT C57BL/6 _versus MyD88_−/−, _Casp1_−/−, _Nlrp3_−/−, or _Nlrc4_−/− mice. GAPDH is shown as a loading control. Representative of three independent experiments. J, Western blot of p-ERK following a time course of infection with Pg in primary mouse macrophages. Supernatant from _Pg_-infected WT or _ASC_−/− mouse macrophages was applied to WT and _ASC_−/− mouse macrophages 5 min prior to infection.
Similar articles
- Cell intrinsic roles of apoptosis-associated speck-like protein in regulating innate and adaptive immune responses.
Hassan H, Amer AO. Hassan H, et al. ScientificWorldJournal. 2011;11:2418-23. doi: 10.1100/2011/429192. Epub 2011 Dec 8. ScientificWorldJournal. 2011. PMID: 22194672 Free PMC article. Review. - A Yersinia effector with enhanced inhibitory activity on the NF-κB pathway activates the NLRP3/ASC/caspase-1 inflammasome in macrophages.
Zheng Y, Lilo S, Brodsky IE, Zhang Y, Medzhitov R, Marcu KB, Bliska JB. Zheng Y, et al. PLoS Pathog. 2011 Apr;7(4):e1002026. doi: 10.1371/journal.ppat.1002026. Epub 2011 Apr 21. PLoS Pathog. 2011. PMID: 21533069 Free PMC article. - Caspase-1/ASC inflammasome-mediated activation of IL-1β-ROS-NF-κB pathway for control of Trypanosoma cruzi replication and survival is dispensable in NLRP3-/- macrophages.
Dey N, Sinha M, Gupta S, Gonzalez MN, Fang R, Endsley JJ, Luxon BA, Garg NJ. Dey N, et al. PLoS One. 2014 Nov 5;9(11):e111539. doi: 10.1371/journal.pone.0111539. eCollection 2014. PLoS One. 2014. PMID: 25372293 Free PMC article. - Inhibition of caspase-1 or gasdermin-D enable caspase-8 activation in the Naip5/NLRC4/ASC inflammasome.
Mascarenhas DPA, Cerqueira DM, Pereira MSF, Castanheira FVS, Fernandes TD, Manin GZ, Cunha LD, Zamboni DS. Mascarenhas DPA, et al. PLoS Pathog. 2017 Aug 3;13(8):e1006502. doi: 10.1371/journal.ppat.1006502. eCollection 2017 Aug. PLoS Pathog. 2017. PMID: 28771586 Free PMC article. - The Dual-Specificity Phosphatase 10 (DUSP10): Its Role in Cancer, Inflammation, and Immunity.
Jiménez-Martínez M, Stamatakis K, Fresno M. Jiménez-Martínez M, et al. Int J Mol Sci. 2019 Apr 1;20(7):1626. doi: 10.3390/ijms20071626. Int J Mol Sci. 2019. PMID: 30939861 Free PMC article. Review.
Cited by
- Cell intrinsic roles of apoptosis-associated speck-like protein in regulating innate and adaptive immune responses.
Hassan H, Amer AO. Hassan H, et al. ScientificWorldJournal. 2011;11:2418-23. doi: 10.1100/2011/429192. Epub 2011 Dec 8. ScientificWorldJournal. 2011. PMID: 22194672 Free PMC article. Review. - Intravenous immunoglobulin suppresses NLRP1 and NLRP3 inflammasome-mediated neuronal death in ischemic stroke.
Fann DY, Lee SY, Manzanero S, Tang SC, Gelderblom M, Chunduri P, Bernreuther C, Glatzel M, Cheng YL, Thundyil J, Widiapradja A, Lok KZ, Foo SL, Wang YC, Li YI, Drummond GR, Basta M, Magnus T, Jo DG, Mattson MP, Sobey CG, Arumugam TV. Fann DY, et al. Cell Death Dis. 2013 Sep 5;4(9):e790. doi: 10.1038/cddis.2013.326. Cell Death Dis. 2013. PMID: 24008734 Free PMC article. - Inflammasome adaptor protein Apoptosis-associated speck-like protein containing CARD (ASC) is critical for the immune response and survival in west Nile virus encephalitis.
Kumar M, Roe K, Orillo B, Muruve DA, Nerurkar VR, Gale M Jr, Verma S. Kumar M, et al. J Virol. 2013 Apr;87(7):3655-67. doi: 10.1128/JVI.02667-12. Epub 2013 Jan 9. J Virol. 2013. PMID: 23302887 Free PMC article. - ASC-dependent RIP2 kinase regulates reduced PGE2 production in chronic periodontitis.
Taxman DJ, Lei Y, Zhang S, Holley-Guthrie E, Offenbacher S, Ting JP. Taxman DJ, et al. J Dent Res. 2012 Sep;91(9):877-82. doi: 10.1177/0022034512454541. Epub 2012 Jul 24. J Dent Res. 2012. PMID: 22828789 Free PMC article. - ASC- and caspase-1-deficient C57BL/6 mice do not develop demyelinating disease after infection with Theiler's murine encephalomyelitis virus.
Li D, Bühler M, Runft S, Gerold G, Marek K, Baumgärtner W, Strowig T, Gerhauser I. Li D, et al. Sci Rep. 2023 Jul 6;13(1):10960. doi: 10.1038/s41598-023-38152-3. Sci Rep. 2023. PMID: 37414913 Free PMC article.
References
- Martinon F., Burns K., Tschopp J. (2002) Mol. Cell 10, 417–426 - PubMed
- Srinivasula S. M., Poyet J. L., Razmara M., Datta P., Zhang Z., Alnemri E. S. (2002) J. Biol. Chem. 277, 21119–21122 - PubMed
- Ting J. P., Kastner D. L., Hoffman H. M. (2006) Nat. Rev. Immunol. 6, 183–195 - PubMed
- Becker C. E., O'Neill L. A. (2007) Semin. Immunopathol. 29, 239–248 - PubMed
Publication types
MeSH terms
Substances
LinkOut - more resources
Full Text Sources
Molecular Biology Databases
Research Materials
Miscellaneous


