Hydroxylation of 5-methylcytosine by TET1 promotes active DNA demethylation in the adult brain - PubMed (original) (raw)
Hydroxylation of 5-methylcytosine by TET1 promotes active DNA demethylation in the adult brain
Junjie U Guo et al. Cell. 2011.
Abstract
Cytosine methylation is the major covalent modification of mammalian genomic DNA and plays important roles in transcriptional regulation. The molecular mechanism underlying the enzymatic removal of this epigenetic mark, however, remains elusive. Here, we show that 5-methylcytosine (5mC) hydroxylase TET1, by converting 5mCs to 5-hydroxymethylcytosines (5hmCs), promotes DNA demethylation in mammalian cells through a process that requires the base excision repair pathway. Though expression of the 12 known human DNA glycosylases individually did not enhance removal of 5hmCs in mammalian cells, demethylation of both exogenously introduced and endogenous 5hmCs is promoted by the AID (activation-induced deaminase)/APOBEC (apolipoprotein B mRNA-editing enzyme complex) family of cytidine deaminases. Furthermore, Tet1 and Apobec1 are involved in neuronal activity-induced, region-specific, active DNA demethylation and subsequent gene expression in the dentate gyrus of the adult mouse brain in vivo. Our study suggests a TET1-induced oxidation-deamination mechanism for active DNA demethylation in mammals.
Copyright © 2011 Elsevier Inc. All rights reserved.
Figures
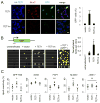
Figure 1. TET1 Catalyses 5mC Hydroxylation and Promotes Demethylation of Exogenous SssI-Methylated Reporter Plasmids and Endogenous Genomic Loci
(A) Reactivation of methylation-silenced reporter plasmids by TET1. Shown on the left are sample images of immunostaining of HEK293 cells co-transfected with SssI-methylated GFP expression plasmids and expression constructs for TET1 or TET1m. Scale bar: 10 μm. Shown on the right is a summary of quantification of GFP+ cells as measured by FACS. Values represent mean ± SEM (n = 3; **: P < 0.01; Student’s t-test). (B) Bisulfite sequencing analysis of reporter plasmids. Shown on the top is a schematic diagram of the region around GFP transcription start site (TSS) for bisulfite sequencing (indicated by the red line). Shown on the left are illustrations of methylation status of CpGs within the sequenced region. Black: methylated; yellow: unmethylated. Note the much higher level of demethylation in GFP+ sorted cells. Shown on the right is a summary of mean numbers of CpGs that are demethylated within each clone. Values represent mean ± SEM (n = 3; *: _P_ < 0.05; Student’s t-test). (C) Effects of TET1 and TET1m overexpression on the HpaII sensitivity of the GFP TSS region and several endogenous genomic loci in HEK293 cells. Open circles represent data from individual experiments and lines represent mean values (**: _P_ < 0.01; *: _P_ < 0.05; #: _P_ > 0.1; Student’s t-test).
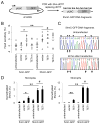
Figure 2. 5hmC-containing DNA Are Demethylated in HEK293 Cells
(A) A schematic diagram of a PCR-based approach to generate 5mC-, or 5hmC-containing DNA fragments, that contain an Ubiquitin promoter (pUbC) followed by the GFP open reading frame. (B) Summary of CpG methylation levels of GFP TSS regions under different conditions as quantified by the HpaII sensitivity. Open circles represent data from individual experiments and lines represent mean values (**: P < 0.01; *: _P_ < 0.05; #: _P_ > 0.1; Student’s t-test). (C and D) Bisulfite sequencing analysis of 5mC-/5hmC-GFP DNA fragments under different conditions. Shown in (C) are sample traces from bisulfite sequencing of 5hmC-GFP DNA before or after transfection. Open and filled triangles indicate cytosines in CpG and CpH contexts, respectively. Arrows indicate demethylated 5hmCs. Shown in (D) are quantifications of demethylated CpGs (left) and CpHs (right) on 5mC-/5hmC-GFP DNA. Values represent mean ± SEM (n = 3; **: P < 0.01; *: _P_ < 0.05; #: _P_ > 0.1; Student’s t-test).
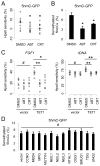
Figure 3. BER Enzyme Activities Are Required for 5hmC Demethylation
(A and B) Effects of PARP1 inhibitor ABT-888 (50 μM) and APE inhibitor CRT0044876 (50 μM) on demethylation of transfected 5hmC-GFP DNA fragments. Shown in (A) is a summary of HpaII sensitivity assay. Open circles represent data from individual experiments and lines represent mean values (*: P < 0.05; Student’s t-test). Shown in (B) is a summary of bisulfite sequencing analysis. Values represent mean ± SEM (n = 3; *: _P_ < 0.05; Student’s t-test). (C) Effects of ABT and CRT on TET1-induced increases of HpaII sensitivity of _FGF1_ (left) and _rDNA_ (right) promoters. Open circles represent data from individual experiments and lines represent mean values (**: _P_ < 0.01; *: _P_ < 0.05; #: _P_ > 0.1; Student’s t-test). (D) Effects of overexpression of human DNA glycosylases on demethylation of 5hmC-GFP DNA fragments. Shown is a summary of bisulfite sequencing analysis of 5hmC-GFP DNA after co-transfection with one of the 12 human DNA glycosylase cDNAs. Values represent mean ± SEM (n = 3; #: P > 0.1; one-way ANOVA).
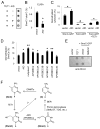
Figure 4. AID/APOBEC Deaminases Promote 5hmC Demethylation
(A and B) Overexpression of AID results in a decrease in the abundance of 5hmCs in genomic DNA samples from HEK 293 cells as monitored by immunoblotting (A) and ELISA (B) using anti-5hmC antibodies. (C) Effects of AID on demethylation of 5hmC-GFP and 5mC-GFP DNA. Values represent mean ± SEM (n = 3; *: P < 0.05; #: _P_ > 0.1; Student’s t-test) (D) Effects of overexpression of AID/APOBEC deaminases on 5hmC demethylation as measured by bisulfite sequencing. Values represent mean ± SEM (n = 3; **: P < 0.01; *: P < 0.05; Student’s t-test). (E) Immunoblotting analysis of 5hmU levels in HEK293 cells after TET1 expression or transfection of 5hmC-GFP DNA, with or without the expression of 5hmU glycosylase SMUG1. (F) An oxidation-deamination-BER model of TET1-induced active DNA demethylation in mammalian cells.
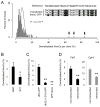
Figure 5. 5hmC Demethylation Recapitulates Known Properties of AID-Catalysed Deamination
(A) A histogram of clone distribution of the percentage of demethylated 5hmCs. A Poisson distribution with λ = 8.4% is shown as a black line. Arrows indicate 3 highly processively demethylated 5hmC-GFP clones. A small portion of the reference sequence and the bisulfite sequencing results for these 3 clones are shown in the inset. (B) Occurrence of single demethylated 5hmCs at WRC and SYC motifs. WRC motif: W = A/T; R = A/G; SYC motif: S = C/G; Y =C/T. Only demethylated 5hmCs that are at least 5 nucleotides away from any other demethylated 5hmCs are analyzed. Values represent mean ± SEM (n = 3; *: P < 0.05; Student t-test). (C) Demethylation of promoter-truncated 5hmC-GFP variants. The same region in the GFP open-reading frame is bisulfite sequenced for all variants. Values represent mean ± SEM (n = 3; **: P < 0.01; Student t-test). (D) Demethylation of 5hmCs in the CpG (left) and CpH (right) contexts on two opposite strands. Demethylated 5hmCs of the forward (untranscribed) strand and the reverse (transcribed) strand are represented by C-to-T and G-to-A transitions in bisulfite sequencing (Figure S5C), respectively. Values represent mean ± SEM (n = 3; **: P < 0.01; Student’s t-test).
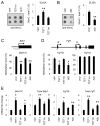
Figure 6. TET1 and AID Regulate Endogenous 5hmC Levels and Promote DNA Demethylation in the Adult Mouse Brain
(A and B) Effects of AAV-mediated overexpression of control YFP, TET1, TET1m (A), and AID (B) on the endogenous 5hmC levels as measured by immunoblotting (left) and ELISA (right). Engineered AAV viruses were stereotaxically injected into the dentate gyrus of adult mice and dentate gyrus tissue was micro-dissected one week later for analysis. Values represent mean ± SEM (n = 3 animals for each condition; **: P < 0.01; Student’s t-test). (C and D) Effects of YFP, TET1, TET1m and AID overexpression on methylation levels of Bdnf IX (C), Fgf1B and Fgf1G (D) alternative promoters in the adult dentate gyrus. Shown on top are diagrams of promoters and bars indicate regions for bisulfite sequencing analysis. Values represent mean ± SEM (n = 3 animals for each condition; **: P < 0.01; *: P < 0.05; Student’s t-test). (E) Effects of YFP, TET1, TET1m and AID overexpression on specific isoform and total expression levels of Fgf1 and Bdnf in the adult dentate gyrus. Same groups of animals as in (C and D) were examined. Values represent mean ± SEM (**: P < 0.01; *: P < 0.05; Student’s t-test).
Figure 7. Tet1 and Apobec1 are Involved in Neuronal Activity-Induced Region-Specific Demethylation in the Adult Mouse Brain
(A to C) Effects of AAV-mediated shRNA knock-down of endogenous Tet1 and Apobec1 on ECS-induced CpG demethylation of Bdnf IX (A), Fgf1B (B) and Fgf1G (C) promoters. Engineered AAV viruses expressing control shRNA (CTL), two shRNAs against mouse Tet1 (Tet1-1 and Tet1-2), and one shRNA against mouse Apobec1 (Ap1-5), were stereotaxically injected into the dentate gyrus of adult mice. One week after viral injection, animals were subjected to ECS or sham treatment. Dentate gyrus tissue was micro-dissected 4 hrs later for analysis. Values represent mean ± SEM (n = 3–6 animals for each condition; **: P < 0.01; *: P < 0.05; Student’s t-test). (D and E) Effects of Tet1 and Apobec1 knock-down on ECS-induced isoform-specific expression of Bdnf and Fgf1 in the adult dentate gyrus. Same groups of animals as in (A to C) were examined. Values represent mean ± SEM (*: P < 0.05; Student’s t-test). (F) Demethylation of 5hmC-GFP DNA fragments after transfection into primary hippocampal neurons in culture. Shown is a histogram of clone distribution of the percentage of demethylated 5hmCs in 5hmC-GFP DNA fragments retrieved 7 days after transfection. A distributive Poisson model (λ = 6.2%) is shown by a black curve.
Similar articles
- DNA demethylation pathways: Additional players and regulators.
Bochtler M, Kolano A, Xu GL. Bochtler M, et al. Bioessays. 2017 Jan;39(1):1-13. doi: 10.1002/bies.201600178. Epub 2016 Nov 16. Bioessays. 2017. PMID: 27859411 Review. - Analysis of TET expression/activity and 5mC oxidation during normal and malignant germ cell development.
Nettersheim D, Heukamp LC, Fronhoffs F, Grewe MJ, Haas N, Waha A, Honecker F, Waha A, Kristiansen G, Schorle H. Nettersheim D, et al. PLoS One. 2013 Dec 26;8(12):e82881. doi: 10.1371/journal.pone.0082881. eCollection 2013. PLoS One. 2013. PMID: 24386123 Free PMC article. - Emerging roles of TET proteins and 5-hydroxymethylcytosines in active DNA demethylation and beyond.
Guo JU, Su Y, Zhong C, Ming GL, Song H. Guo JU, et al. Cell Cycle. 2011 Aug 15;10(16):2662-8. doi: 10.4161/cc.10.16.17093. Epub 2011 Aug 15. Cell Cycle. 2011. PMID: 21811096 Free PMC article. Review. - Active DNA demethylation by DNA repair: Facts and uncertainties.
Schuermann D, Weber AR, Schär P. Schuermann D, et al. DNA Repair (Amst). 2016 Aug;44:92-102. doi: 10.1016/j.dnarep.2016.05.013. Epub 2016 May 16. DNA Repair (Amst). 2016. PMID: 27247237 Review. - GADD45a physically and functionally interacts with TET1.
Kienhöfer S, Musheev MU, Stapf U, Helm M, Schomacher L, Niehrs C, Schäfer A. Kienhöfer S, et al. Differentiation. 2015 Jul-Oct;90(1-3):59-68. doi: 10.1016/j.diff.2015.10.003. Epub 2015 Nov 3. Differentiation. 2015. PMID: 26546041 Free PMC article.
Cited by
- Potential of whole-genome sequencing for determining risk and personalizing therapy: focus on AML.
Borate U, Absher D, Erba HP, Pasche B. Borate U, et al. Expert Rev Anticancer Ther. 2012 Oct;12(10):1289-97. doi: 10.1586/era.12.116. Expert Rev Anticancer Ther. 2012. PMID: 23176617 Free PMC article. - Targeting the nucleotide salvage factor DNPH1 sensitizes _BRCA_-deficient cells to PARP inhibitors.
Fugger K, Bajrami I, Silva Dos Santos M, Young SJ, Kunzelmann S, Kelly G, Hewitt G, Patel H, Goldstone R, Carell T, Boulton SJ, MacRae J, Taylor IA, West SC. Fugger K, et al. Science. 2021 Apr 9;372(6538):156-165. doi: 10.1126/science.abb4542. Science. 2021. PMID: 33833118 Free PMC article. - Biochemical characterization of recombinant β-glucosyltransferase and analysis of global 5-hydroxymethylcytosine in unique genomes.
Terragni J, Bitinaite J, Zheng Y, Pradhan S. Terragni J, et al. Biochemistry. 2012 Feb 7;51(5):1009-19. doi: 10.1021/bi2014739. Epub 2012 Jan 27. Biochemistry. 2012. PMID: 22229759 Free PMC article. - DNA Methylation in Memory Formation: Emerging Insights.
Heyward FD, Sweatt JD. Heyward FD, et al. Neuroscientist. 2015 Oct;21(5):475-89. doi: 10.1177/1073858415579635. Epub 2015 Apr 1. Neuroscientist. 2015. PMID: 25832671 Free PMC article. Review. - Crosstalk among Epigenetic Pathways Regulates Neurogenesis.
Jobe EM, McQuate AL, Zhao X. Jobe EM, et al. Front Neurosci. 2012 May 8;6:59. doi: 10.3389/fnins.2012.00059. eCollection 2012. Front Neurosci. 2012. PMID: 22586361 Free PMC article.
References
- Baker D, Liu P, Burdzy A, Sowers LC. Characterization of the substrate specificity of a human 5-hydroxymethyluracil glycosylase activity. Chem Res Toxicol. 2002;15:33–39. - PubMed
- Boorstein RJ, Cummings A, Jr, Marenstein DR, Chan MK, Ma Y, Neubert TA, Brown SM, Teebor GW. Definitive identification of mammalian 5-hydroxymethyluracil DNA N-glycosylase activity as SMUG1. J Biol Chem. 2001;276:41991–41997. - PubMed
Publication types
MeSH terms
Substances
Grants and funding
- R01 HD069184/HD/NICHD NIH HHS/United States
- R01 HD069184-01/HD/NICHD NIH HHS/United States
- R01 AG024984/AG/NIA NIH HHS/United States
- NS048271/NS/NINDS NIH HHS/United States
- R37 NS047344/NS/NINDS NIH HHS/United States
- MH087874/MH/NIMH NIH HHS/United States
- R56 NS047344/NS/NINDS NIH HHS/United States
- R01 NS047344-09/NS/NINDS NIH HHS/United States
- R01 NS048271/NS/NINDS NIH HHS/United States
- R01 NS047344/NS/NINDS NIH HHS/United States
- R01 AG024984-05/AG/NIA NIH HHS/United States
- R01 NS048271-06/NS/NINDS NIH HHS/United States
- R21 MH087874/MH/NIMH NIH HHS/United States
- AG024984/AG/NIA NIH HHS/United States
- R33 MH087874/MH/NIMH NIH HHS/United States
- HD069184/HD/NICHD NIH HHS/United States
- NS047344/NS/NINDS NIH HHS/United States
LinkOut - more resources
Full Text Sources
Other Literature Sources
Molecular Biology Databases
Research Materials
