Normalizing bead-based microRNA expression data: a measurement error model-based approach - PubMed (original) (raw)
Normalizing bead-based microRNA expression data: a measurement error model-based approach
Bin Wang et al. Bioinformatics. 2011.
Abstract
Motivation: Compared with complementary DNA (cDNA) or messenger RNA (mRNA) microarray data, microRNA (miRNA) microarray data are harder to normalize due to the facts that the total number of miRNAs is small, and that the majority of miRNAs usually have low expression levels. In bead-based microarrays, the hybridization is completed in several pools. As a result, the number of miRNAs tested in each pool is even smaller, which poses extra difficulty to intrasample normalization and ultimately affects the quality of the final profiles assembled from various pools. In this article, we consider a measurement error model-based method for bead-based microarray intrasample normalization.
Results: In this study, results from quantitative real-time PCR (qRT-PCR) assays are used as 'gold standards' for validation. The performance of the proposed measurement error model-based method is evaluated via a simulation study and real bead-based miRNA expression data. Simulation results show that the new method performs well to assemble complete profiles from subprofiles from various pools. Compared with two intrasample normalization methods recommended by the manufacturer, the proposed approach produces more robust final complete profiles and results in better agreement with the qRT-PCR results in identifying differentially expressed miRNAs, and hence improves the reproducibility between the two microarray platforms. Meaningful results are obtained by the proposed intrasample normalization method, together with quantile normalization as a subsequent complemental intersample normalization method.
Availability: Datasets and R package are available at http://gauss.usouthal.edu/publ/beadsme/.
Figures
Fig. 1.
All results are based on the experimental data for one specimen. Plot (a) shows the original intensity distributions of the four samples (before normalization). Plot (b) shows the logarithmic intensity distributions of the four samples (before normalization). Each of plots (c) through (f) shows the logarithmic intensity distributions of the five subprofiles of the four samples.
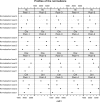
Fig. 2.
Profiles of the four normalizers in the five pools (in columns) for the four samples (in rows) for 1 of the 10 specimens. Original scale nMFIs are shown in the _x_-axis.
Fig. 3.
Box-plots of the D's based on 10 000 repeats: left, nmean; middle, nmed; right, nme.
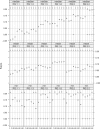
Fig. 4.
Weighted Kappa coefficient comparisons for different intrasample normalization methods, under various FC and RQ cutoffs, and with Qnorm as intersample normalization method.
Similar articles
- A personalized microRNA microarray normalization method using a logistic regression model.
Wang B, Wang XF, Howell P, Qian X, Huang K, Riker AI, Ju J, Xi Y. Wang B, et al. Bioinformatics. 2010 Jan 15;26(2):228-34. doi: 10.1093/bioinformatics/btp655. Epub 2009 Nov 23. Bioinformatics. 2010. PMID: 19933824 - A comparison of normalization techniques for microRNA microarray data.
Rao Y, Lee Y, Jarjoura D, Ruppert AS, Liu CG, Hsu JC, Hagan JP. Rao Y, et al. Stat Appl Genet Mol Biol. 2008;7(1):Article22. doi: 10.2202/1544-6115.1287. Epub 2008 Jul 21. Stat Appl Genet Mol Biol. 2008. PMID: 18673291 - Normalization matters: tracking the best strategy for sperm miRNA quantification.
Corral-Vazquez C, Blanco J, Salas-Huetos A, Vidal F, Anton E. Corral-Vazquez C, et al. Mol Hum Reprod. 2017 Jan;23(1):45-53. doi: 10.1093/molehr/gaw072. Epub 2016 Dec 8. Mol Hum Reprod. 2017. PMID: 27932553 - Expression profiling of microRNA using real-time quantitative PCR, how to use it and what is available.
Benes V, Castoldi M. Benes V, et al. Methods. 2010 Apr;50(4):244-9. doi: 10.1016/j.ymeth.2010.01.026. Epub 2010 Jan 28. Methods. 2010. PMID: 20109550 Review. - Data Normalization Strategies for MicroRNA Quantification.
Schwarzenbach H, da Silva AM, Calin G, Pantel K. Schwarzenbach H, et al. Clin Chem. 2015 Nov;61(11):1333-42. doi: 10.1373/clinchem.2015.239459. Epub 2015 Sep 25. Clin Chem. 2015. PMID: 26408530 Free PMC article. Review.
Cited by
- Testing for differentially-expressed microRNAs with errors-in-variables nonparametric regression.
Wang B, Zhang SG, Wang XF, Tan M, Xi Y. Wang B, et al. PLoS One. 2012;7(5):e37537. doi: 10.1371/journal.pone.0037537. Epub 2012 May 24. PLoS One. 2012. PMID: 22655055 Free PMC article. - Predicting MicroRNA Biomarkers for Cancer Using Phylogenetic Tree and Microarray Analysis.
Wang H. Wang H. Int J Mol Sci. 2016 May 19;17(5):773. doi: 10.3390/ijms17050773. Int J Mol Sci. 2016. PMID: 27213352 Free PMC article. - Simultaneous Improvement in the Precision, Accuracy, and Robustness of Label-free Proteome Quantification by Optimizing Data Manipulation Chains.
Tang J, Fu J, Wang Y, Luo Y, Yang Q, Li B, Tu G, Hong J, Cui X, Chen Y, Yao L, Xue W, Zhu F. Tang J, et al. Mol Cell Proteomics. 2019 Aug;18(8):1683-1699. doi: 10.1074/mcp.RA118.001169. Epub 2019 May 16. Mol Cell Proteomics. 2019. PMID: 31097671 Free PMC article. - Hypoxia-regulated microRNAs in human cancer.
Shen G, Li X, Jia YF, Piazza GA, Xi Y. Shen G, et al. Acta Pharmacol Sin. 2013 Mar;34(3):336-41. doi: 10.1038/aps.2012.195. Epub 2013 Feb 4. Acta Pharmacol Sin. 2013. PMID: 23377548 Free PMC article. Review. - The effects of error magnitude and bandwidth selection for deconvolution with unknown error distribution.
Wang XF, Ye D. Wang XF, et al. J Nonparametr Stat. 2012 Jan 1;24(1):153-167. doi: 10.1080/10485252.2011.647024. Epub 2012 Jan 30. J Nonparametr Stat. 2012. PMID: 22754269 Free PMC article.
References
- Bolstad B.M., et al. A comparison of normalization methods for high density oligonucleotide array data based on variance and bias. Bioinformatics. 2003;19:185–193. - PubMed
- Bruheim S., et al. Gene expression profiles classify human osteosarcoma xenografts according to sensitivity to doxorubicin, cisplatin, and ifosfamide. Clin. Cancer Res. 2009;15:7161–7169. - PubMed
- Cohen J. A coefficient of agreement for nominal scales. Educ. Psychol. Meas. 1960;20:37–46.
- Davison T.S., et al. Analyzing micro-RNA expression using microarrays. Methods Enzymol. 2006;411:14–34. - PubMed
- Dudoit S., et al. Statistical methods for identifying genes with differential expression in replicated cDNA microarray experiments. Stat. Sin. 2002;12:111–139.
Publication types
MeSH terms
Substances
LinkOut - more resources
Full Text Sources
Research Materials


