B cells promote insulin resistance through modulation of T cells and production of pathogenic IgG antibodies - PubMed (original) (raw)
doi: 10.1038/nm.2353. Epub 2011 Apr 17.
Shawn Winer, Lei Shen, Persis P Wadia, Jason Yantha, Geoffrey Paltser, Hubert Tsui, Ping Wu, Matthew G Davidson, Michael N Alonso, Hwei X Leong, Alec Glassford, Maria Caimol, Justin A Kenkel, Thomas F Tedder, Tracey McLaughlin, David B Miklos, H-Michael Dosch, Edgar G Engleman
Affiliations
- PMID: 21499269
- PMCID: PMC3270885
- DOI: 10.1038/nm.2353
B cells promote insulin resistance through modulation of T cells and production of pathogenic IgG antibodies
Daniel A Winer et al. Nat Med. 2011 May.
Abstract
Chronic inflammation characterized by T cell and macrophage infiltration of visceral adipose tissue (VAT) is a hallmark of obesity-associated insulin resistance and glucose intolerance. Here we show a fundamental pathogenic role for B cells in the development of these metabolic abnormalities. B cells accumulate in VAT in diet-induced obese (DIO) mice, and DIO mice lacking B cells are protected from disease despite weight gain. B cell effects on glucose metabolism are mechanistically linked to the activation of proinflammatory macrophages and T cells and to the production of pathogenic IgG antibodies. Treatment with a B cell-depleting CD20 antibody attenuates disease, whereas transfer of IgG from DIO mice rapidly induces insulin resistance and glucose intolerance. Moreover, insulin resistance in obese humans is associated with a unique profile of IgG autoantibodies. These results establish the importance of B cells and adaptive immunity in insulin resistance and suggest new diagnostic and therapeutic modalities for managing the disease.
Figures
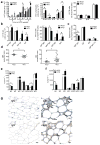
Figure 1. B cell and antibody profile in DIO mice
(a) Time course of T cell (T), B cell (B) and monocyte (M) infiltration of VAT after initiation of HFD (left, 2 experiments, 5 mice, *P < 0.05). B cell subsets in VAT in response to 6–12 weeks of HFD in absolute numbers (middle) of B cells (*P = 0.005), B1a cells (*P = 0.04), B1b cells, non-B1 cells/B2 (*P = 0.04) and T cells (*P = 0.03), and in percentages of CD19+ cells (right); middle and right, 3 experiments, 9 mice. (b) VAT B cells in absolute numbers (left,*P < 0.05) and proportion of CD19+ cells (right, *P < 0.05); left and right, 3 experiments each, 9 mice. (c) Spleen B cell subsets in response to HFD (MZ, marginal zone; FC, follicular cells, *P = 0.01, n = 5). (d) Spontaneous production of IgM (left, *P = 0.0006) and IgG (*P = 0.01) from mouse splenocytes (e) Serum antibody concentrations in mice: IgA (*P = 0.03) and IgG2c (*P = 0.004) (n = 10). (f) Antibody subtypes in VAT lysates from mice (*P = 0.0001) (2 experiments, 5 mice). (g) IgM (top left) and IgG (bottom left) staining in VAT of HFD mice in regions of few and multiple CLSs (IgM top right; IgG bottom right) (arrows indicate antibody stained cells, bar 50 μm left and 25 μm right). Graphs are means ± s.e.m.
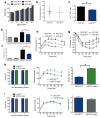
Figure 2. B cell deficiency modulates glucose metabolism in DIO mice
(a) Body weights of WT and Bnull mice over time (n = 10 per group). (b) Relative fat cell diameter of 14–18 week old HFD mice (n = 3). (c) Ratio of epididymal VAT and SAT pad weights in HFD mice (*P = 0.004, n = 10) (d) Fasting glucose (*P = 0.04, n = 10) and (e) glucose tolerance test (GTT) of WT or Bnull mice on NCD or HFD (*P < 0.05, representative GTT from 3 experiments, n=10 per group on HFD and 2 experiments, n=5 per group on NCD). (f) Fasting serum insulin concentrations of 16 week old WT or Bnull mice on NCD or HFD (*P = 0.04, n = 10). (g) Insulin tolerance test (ITT) in WT or Bnull mice on NCD or HFD (*P < 0.05, n = 5 per group). (h) Body weight (left), GTT (middle, *P < 0.05, n = 6), and fasting insulin (right, *P = 0.02, n = 6) of HFD Bnull mice 2 weeks following reconstitution with HFD WT B cells (representative of 3 independent experiments). (i) Body weight (left), GTT (middle, n = 5), and fasting insulin (right, n = 5) of HFD Bnull mice 2 weeks following reconstitution with NCD WT B cells (representative of 2 independent experiments). Graphs are means ± s.e.m.
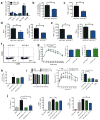
Figure 3. B cells influence VAT T cell and macrophage function
(a) Numbers of cell subsets in VAT of 14–18 week old mice (4 experiments, 10 mice). (b) Percentage of VAT macrophages (CD11b+F4/80+Gr-1-) with M1 phenotype (*P = 0.049, 3 experiments, 8 mice). (c) IFN-γ production from SVC cultures of VAT (3 experiments, 9 mice, *P = 0.02). (d) Intracellular IFN-γ staining of CD8+ T cells isolated from VAT (left, 4 experiments,10 mice, *P = 0.04) and percentage of total VAT CD8+ T cells expressing CD107a (right, *P = 0.02, 2 experiments, 6 mice). (e) TNF-α production from VAT SVC cultures (left, *P = 0.04, 2 experiments, 6 mice) and intracellular staining of TNF-α in VAT macrophages (right, 2 experiments, 6 mice, *P = 0.02). (f) CD80 and CD86 expression on VAT macrophages (representative of 3 experiments, 9 mice). (g) GTT (left), fasting glucose (middle) and fasting insulin (right) of recipient HFD RAGnull mice 2 weeks after transfer of HFD B cells (n = 10). (h) CD19+ B cells in VAT of Bnull mice 2 weeks after reconstitution with various B cells (3 experiments, 9 mice). (i) Weights (left), GTT (middle) and fasting insulin (right) of recipient mice 2 weeks after transfer of various B cells (*P < 0.05, representative of 3 experiments, n = 3 per group). (j) IFN-γ production from VAT SVC cultures (left), and intracellular IFN-γ in VAT CD8+ T cells (middle) and VAT CD4+ T cells (right) isolated from recipient Bnull mice receiving either PBS orvarious B cells (*P < 0.05, 2 experiments, 6 mice). Graphs are means ± s.e.m.
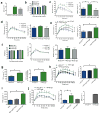
Figure 4. IgG antibodies from obese mice induce abnormal glucose metabolism in recipient Bnull mice
(a) Serum concentration of IgG in Bnull mice one week following i.p. IgG injection (n = 3). (b) Body weights of HFD Bnull recipient mice after IgG transfer (representative of 3 experiments, n = 4). (c) GTT (left, * P < 0.05) and fasting insulin (right, *P < 0.05) one week following transfer of IgG into 16 week old HFD Bnull mice (representative of 3 experiments, n = 4). (d) GTT (left) and fasting insulin (right) four weeks following transfer of IgG (representative of 2 experiments, n = 4). (e) GTT (left, *P < 0.05) and fasting insulin (right, *P = 0.048) one week following transfer of late or early IgG (n = 5). (f) Weights (left), GTT (center), and fasting insulin (right) of 6 week old NCD Bnull mice 1 week after IgG transfer (representative of 2 experiments, n = 4). (g) TNF-α from VAT SVC cultures (left, *P = 0.04, 2 experiments, 6 mice) and M1 macrophages in HFD Bnull VAT one week after IgG transfer (right, *P = 0.007, 2 experiments, 6 mice). (h) GTT (left, *P < 0.05) and fasting insulin (right, *P = 0.04) one week after transfer of HFD Ig (n =5). (i) TNF-α from HFD Bnull VAT macrophages stimulated in vitro with HFD IgG (*_P_= 0.007), or HFD F(ab′)2 (n = 3). j) GTT (left) and fasting insulin (middle) of HFD Bnull mice 1 week after receiving HFD Ig (n = 5, *P < 0.05). Serum concentration (right) of IgM in HFD Bnull mice 1 week following IgM injection (n = 3). Graphs are means ± s.e.m.
Figure 5. A CD20-specific B cell-depleting antibody improves obesity induced glucose abnormalities
Age matched 12–13 week old (6–7 weeks on HFD) HFD WT mice were treated with MB20-11 CD20 mAb (100 μg i.v.). (a) Percentage of CD19+ cells depleted in VAT and spleen ≥8 days following administration of CD20 mAb. (b) Weights of mice and (c) percentage depletion of IgG and IgM antibody in serum 28 days post CD20 mAb treatment (representative of two experiments, n = 5). (d) Fasting glucose (*P = 0.06), (e) GTT (*P < 0.05) and (f) fasting insulin (*P = 0.04) in HFD WT mice 28 days after receiving either CD20 mAb or control (IgG2c or PBS) (representative of two experiments, n = 5). (g, h) IFN-γ (*P = 0.003) and TNF-α (*P = 0.005) production from SVC cultures of VAT isolated from 17 week old mice treated with CD20 mAb at 13 weeks of age (2 experiments, 8 mice). i) Percentage of VAT macrophages expressing TNF-α 4 weeks after treatment with CD20 mAb (*P = 0.01, 2 experiments, 8 mice). Graphs are means ± s.e.m.
Comment in
- The B-side story in insulin resistance.
Mallat Z. Mallat Z. Nat Med. 2011 May;17(5):539-40. doi: 10.1038/nm0511-539. Nat Med. 2011. PMID: 21546966 No abstract available. - The bigger B cell picture.
Mackay F. Mackay F. Nat Rev Immunol. 2016 Mar;16(3):133. doi: 10.1038/nri.2016.3. Epub 2016 Jan 25. Nat Rev Immunol. 2016. PMID: 26806483 No abstract available.
Similar articles
- Protective Role for B-1b B Cells and IgM in Obesity-Associated Inflammation, Glucose Intolerance, and Insulin Resistance.
Harmon DB, Srikakulapu P, Kaplan JL, Oldham SN, McSkimming C, Garmey JC, Perry HM, Kirby JL, Prohaska TA, Gonen A, Hallowell P, Schirmer B, Tsimikas S, Taylor AM, Witztum JL, McNamara CA. Harmon DB, et al. Arterioscler Thromb Vasc Biol. 2016 Apr;36(4):682-91. doi: 10.1161/ATVBAHA.116.307166. Epub 2016 Feb 11. Arterioscler Thromb Vasc Biol. 2016. PMID: 26868208 Free PMC article. - Regulation of adipose tissue T cell subsets by Stat3 is crucial for diet-induced obesity and insulin resistance.
Priceman SJ, Kujawski M, Shen S, Cherryholmes GA, Lee H, Zhang C, Kruper L, Mortimer J, Jove R, Riggs AD, Yu H. Priceman SJ, et al. Proc Natl Acad Sci U S A. 2013 Aug 6;110(32):13079-84. doi: 10.1073/pnas.1311557110. Epub 2013 Jul 22. Proc Natl Acad Sci U S A. 2013. PMID: 23878227 Free PMC article. - B Lymphocytes in obesity-related adipose tissue inflammation and insulin resistance.
Winer DA, Winer S, Chng MH, Shen L, Engleman EG. Winer DA, et al. Cell Mol Life Sci. 2014 Mar;71(6):1033-43. doi: 10.1007/s00018-013-1486-y. Epub 2013 Oct 15. Cell Mol Life Sci. 2014. PMID: 24127133 Free PMC article. Review. - Perforin is a novel immune regulator of obesity-related insulin resistance.
Revelo XS, Tsai S, Lei H, Luck H, Ghazarian M, Tsui H, Shi SY, Schroer S, Luk CT, Lin GH, Mak TW, Woo M, Winer S, Winer DA. Revelo XS, et al. Diabetes. 2015 Jan;64(1):90-103. doi: 10.2337/db13-1524. Epub 2014 Jul 21. Diabetes. 2015. PMID: 25048196 - Immunological goings-on in visceral adipose tissue.
Mathis D. Mathis D. Cell Metab. 2013 Jun 4;17(6):851-859. doi: 10.1016/j.cmet.2013.05.008. Cell Metab. 2013. PMID: 23747244 Free PMC article. Review.
Cited by
- Transcriptional signatures related to glucose and lipid metabolism predict treatment response to the tumor necrosis factor antagonist infliximab in patients with treatment-resistant depression.
Mehta D, Raison CL, Woolwine BJ, Haroon E, Binder EB, Miller AH, Felger JC. Mehta D, et al. Brain Behav Immun. 2013 Jul;31:205-15. doi: 10.1016/j.bbi.2013.04.004. Epub 2013 Apr 25. Brain Behav Immun. 2013. PMID: 23624296 Free PMC article. Clinical Trial. - Pathogenic mechanisms involving the interplay between adipose tissue and auto-antibodies in rheumatoid arthritis.
Arias-de la Rosa I, Escudero-Contreras A, Ruiz-Ponce M, Cuesta-López L, Román-Rodríguez C, Pérez-Sánchez C, Ruiz-Limón P, Ruiz RG, Leiva-Cepas F, Alcaide J, Segui P, Plasencia C, Martinez-Feito A, Font P, Ábalos MC, Ortega R, Malagón MM, Tinahones FJ, Collantes-Estévez E, López-Pedrera C, Barbarroja N. Arias-de la Rosa I, et al. iScience. 2022 Aug 6;25(9):104893. doi: 10.1016/j.isci.2022.104893. eCollection 2022 Sep 16. iScience. 2022. PMID: 36046189 Free PMC article. - Adipose tissue attracts and protects acute lymphoblastic leukemia cells from chemotherapy.
Pramanik R, Sheng X, Ichihara B, Heisterkamp N, Mittelman SD. Pramanik R, et al. Leuk Res. 2013 May;37(5):503-9. doi: 10.1016/j.leukres.2012.12.013. Epub 2013 Jan 17. Leuk Res. 2013. PMID: 23332453 Free PMC article. - LINE-1 methylation in visceral adipose tissue of severely obese individuals is associated with metabolic syndrome status and related phenotypes.
Turcot V, Tchernof A, Deshaies Y, Pérusse L, Bélisle A, Marceau S, Biron S, Lescelleur O, Biertho L, Vohl MC. Turcot V, et al. Clin Epigenetics. 2012 Jul 2;4(1):10. doi: 10.1186/1868-7083-4-10. Clin Epigenetics. 2012. PMID: 22748066 Free PMC article. - Moving beyond HLA: a review of nHLA antibodies in organ transplantation.
Sigdel TK, Sarwal MM. Sigdel TK, et al. Hum Immunol. 2013 Nov;74(11):1486-90. doi: 10.1016/j.humimm.2013.07.001. Epub 2013 Jul 19. Hum Immunol. 2013. PMID: 23876683 Free PMC article. Review.
References
- Olefsky JM, Glass CK. Macrophages, inflammation, and insulin resistance. Annu Rev Physiol. 2010;72:219–246. - PubMed
- Yuan M, et al. Reversal of obesity- and diet-induced insulin resistance with salicylates or targeted disruption of Ikkbeta. Science. 2001;293:1673–1677. - PubMed
Publication types
MeSH terms
Substances
Grants and funding
- 111156/CAPMC/ CIHR/Canada
- T32 AI007290/AI/NIAID NIH HHS/United States
- R01 DK082537/DK/NIDDK NIH HHS/United States
- DK082537/DK/NIDDK NIH HHS/United States
- CA141468/CA/NCI NIH HHS/United States
- R01 DK080436/DK/NIDDK NIH HHS/United States
- U01 CA141468/CA/NCI NIH HHS/United States
LinkOut - more resources
Full Text Sources
Other Literature Sources
Molecular Biology Databases


