Unidirectional transfer of microRNA-loaded exosomes from T cells to antigen-presenting cells - PubMed (original) (raw)
Unidirectional transfer of microRNA-loaded exosomes from T cells to antigen-presenting cells
María Mittelbrunn et al. Nat Commun. 2011.
Free PMC article
Abstract
The immune synapse is an exquisitely evolved means of communication between T cells and antigen-presenting cells (APCs) during antigen recognition. Recent evidence points to the transfer of RNA via exosomes as a novel mode of intercellular communication. Here we show that exosomes of T, B and dendritic immune cells contain microRNA (miRNA) repertoires that differ from those of their parent cells. We investigate whether miRNAs are exchanged during cognate immune interactions, and demonstrate the existence of antigen-driven unidirectional transfer of miRNAs from the T cell to the APC, mediated by the delivery of CD63+ exosomes on immune synapse formation. Inhibition of exosome production by targeting neutral sphingomyelinase-2 impairs transfer of miRNAs to APCs. Moreover, miRNAs transferred during immune synapsis are able to modulate gene expression in recipient cells. Thus, our results support a mechanism of cellular communication involving antigen-dependent, unidirectional intercellular transfer of miRNAs by exosomes during immune synapsis.
Figures
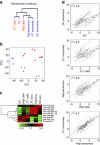
Figure 1. microRNA profiles of exosomes and their parental cells.
(a) Microarray analysis of exosomal miRNAs versus the miRNAs of their respective donor cells. Exosomes were isolated by serial centrifugation and filtration steps from supernatants of donor cells cultured in RPMI-1640 supplemented with exosome-depleted FBS (10%). Total RNA, including microRNA, was isolated from exosomes and their donor cells and miRNA profiles were assessed by microarray technology. The panel shows the hierarchical clustering of the VSN-normalized array data in the log2 scale averaged per biological replicate for each origin (exosomes per cells) and cell type. DC, dendritic cells; J77, Jurkat-derived J77 T cell line; Raji, Raji B cell line). (b) Principal component analysis (PCA) of all normalized array data. Each point represents a hybridized sample: that is, different biological samples per origin and cell type. x axis, first principal component (PC1); y axis, second principal component (PC2). Cell samples, red; exosomal samples, blue. (c) Heatmap of the VSN-normalized data for selected miRNAs. For visualization purposes the expression profiles were centred on the median of the profile. The scale bar across the bottom depicts standard deviation change from the mean. (d) Scatter plots of the exosome versus cell averaged array data in each cell type and of Raji exosomes versus J77 exosomes. The correlation is shown.
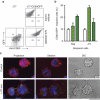
Figure 2. Uptake of CD63-GFP exosomes by immune cells.
(a) Untransfected J77 T cells and J77 T cells stably expressing CD63-GFP (J77-CD63-GFP cells) were cultured in exosome-depleted medium for 24 h and exosomes were purified from supernatants by ultracentrifugation. Exosomes were labelled with anti-CD63-phycoerythrin and analysed by flow cytometry. (b) Uptake of CD63-GFP exosomes by T cells and B cells (recipient cells). Untransfected cells were incubated with CD63-GFP exosomes for 16 h and analysed by flow cytometry. Data represent the percentage of GFP-positive cells (±s.e.m.) of three independent experiments. Open bars, no exosomes; striped bars, Raji exosomes; filled bars, J77 exosomes. (c) Confocal microscopy detection of CD63-GFP (green) on the surface of recipient cells (Raji) after incubation with J77-CD63-GFP exosomes. Cell membranes were stained for the cell-surface molecule CD45 (red) and nuclei were stained with HOESCHT (blue). Images show maximal projections of confocal images (projection), one representative confocal section (section) and the DIC images. Scale bar, 10 ìm.
Figure 3. MVBs in T cells translocate to the IS.
(a) J77 T cells were conjugated with SEE-pulsed or non-pulsed Raji B cells loaded with CMAC (blue). After 30 min, cells were fixed and stained for the MVB marker Hrs (red), CD3 and actin (both green). Plates show maximal projections of confocal images and the DIC images. (b) CH7C17 T cells were conjugated with HA-loaded or non-loaded HOM2 B cells (blue). After 30 min, cells were fixed and stained for CD63 (green), CD3 and actin (both red). Plates show maximal projections of confocal images and the DIC images, scale bars applies to a and b. (c) Percentage of T and APC cells in which CD63, Hrs and CD3 relocalized to the T cell–APC contact area in the presence of HA peptide (filled bars) or its absence (open bars). Data are the arithmetic means±s.e.m. of four experiments. *P<0.03 compared with the absence of antigen (Mann–Whitney test). (d) Live cell imaging of J77-CD63-GFP cells seeded on fibronectin-coated coverslips and conjugated with SEE-primed Raji cells (blue). Cells were monitored by time-lapse confocal microscopy at 30 s intervals. Plates show maximal projections of confocal images. Scale bars, 10 ìm.
Figure 4. Ag recognition induces transfer of exosomes from T cell to APC.
(a) Left: J77-CD63-GFP donor cells were conjugated with SEE-primed or unprimed Raji cells (recipient, in blue). Right: Raji-CD63-GFP donor cells (±SEE) were conjugated with blue-labeled J77 recipients. After 16 h, cocultures were analysed by flow cytometry. Bar chart shows the percentage±s.e.m. of positive recipient cells (_n_=9, P<0.001, Student's _t_-test). (b) J77 cells transfected with CD69-GFP or GFP were conjugated with SEE-primed Raji cells (blue) and analysed as in a. (c) FACS analysis of the percentage of GFP-positive Raji cells after incubation with J77-CD63-GFP cells in contact with coculture as in a (control), in the presence of inhibitors of actin (latrunculin-A, LatA or cytochalasin-D, CytD) or tubulin (nocodazol, NCD), or after incubation with separation of donors and recipients by a 0.4 μm pore-size transwell membrane (Twell). T cells in transwells were activated with CD3+CD28 Abs and Raji cells were loaded with SEE. (d) J77-CD63-GFP donor cells were conjugated with a 1:1 mix of two B cell lines: Raji cells (black) and BLS-1 cells (blue) and analysed as in a. Bar chart shows percentages±s.e.m. of positive recipient cells (_n_=6, P<0.005, Mann–Whitney test). Maximal projections of confocal images and the DIC of a triple conjugated formed by J77-CD63-GFP (green), Raji cells (black asterisk) and BLS-1 (CMAC stained and blue asterisk), stained for CD3 (red) are shown, scale bar shown in e. (e) Confocal analysis of Raji cells that acquired CD63-GFP directly from J77-CD63-GFP after IS formation (IS-dependent transfer) or after external administration of CD63-GFP exosomes isolated from J77-CD63GFP supernatants (non-synaptic uptake). Cells were stained for MHC-II (red). Images show maximal projections of confocal images, one representative confocal section, and the DIC images. Plots show cell perimeter fluorescence intensity profiles of the green and the red signals. ARU: arbitrary relative units. Scale bar, 10 ìm. (f) Raji cells (±SEE) were treated as in e. FACS analysis of the effect of trypsin on the CD63-GFP content of Raji cells that acquired exosomes by IS-dependent transfer or non-synaptic uptake. White bars, control; grey bars, 10 min trypsin; black bars, 10 min+10 min trypsin. Bar chart shows percentages±s.e.m. of positive cells (_n_=3).
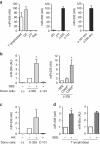
Figure 5. Exosomal miRNA-335 is transferred from T cell to APC in an Ag-specific manner.
(a) Levels of miR-335 were assessed by quantitative reverse transcription PCR (qRT–PCR) in primary dendritic cells and T lymphoblasts, and in Raji and J77 cells. J77-CD63-GFP cells were stably transduced with miR-335 (J-335 cells) or miR-101 (J-101 cells), and miR-335 levels were determined by qRT–PCR in cells and derived exosomes. Data are representative of three experiments (mean and s.e.m.) (b) miR-335 levels in SEE-primed Raji cells sorted 24 h after conjugation with J-335 cells. J-101 were used as control donor cells. Left panel, Data are representative of seven independent experiments (mean and s.e.m), _P_=0.014 (one-sample _t_-test). Right panel, _n_=5 independent experiments; _P_=0.04 (one-sample _t_-test); error bars represent s.e.m. (c) miR-335 levels in HA-primed HOM-2 cells sorted 24 h after conjugation with CH7C17 cells overexpressing miR-335 (C-335). CH7C17 cells overexpressing miR-101 (C-101) were used as control donor cells. Data are representative of five experiments (mean and s.e.m.). (d) miR-335 and miR-92a levels in SEE-primed Raji cells sorted 24 h after conjugation with primary T lymphoblasts-expressing miR-335 and miR-92a endogenously. Data are representative of three experiments (mean and s.e.m.), *_P_=0.026 (one-sample _t_-test) AU, arbitrary units.
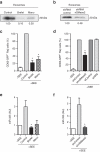
Figure 6. Inhibition of exosome biogenesis impairs transfer of exosomal miRNAs and proteins through the IS.
(a) J77 cells were cultured in exosome-depleted medium for 24 h, in the presence of inhibitors of nSMase2 (manumycin-A, Manu) or BIG2 (brefeldin, Brefel). Purified exosomes secreted by equal numbers of control or treated cells were analysed by immunoblotting for the presence of the exosome marker CD81. Densitometric analyses were performed, and the ratio between the treated and the control condition is shown. (b) CD81 immunoblot of exosomes purified from equal numbers of cells transduced with control or nSMase2 shRNA. Densitometric analyses were performed, and the ratio between the silenced and the control condition is shown. (c) FACS analysis of the CD63-GFP content of Raji recipients cells after conjugation with J-335 cells in the presence of manumycin or brefeldin. Data are the percentage±s.e.m. of Raji-GFP-positive recipient cells relative to the SEE-loaded control condition. _n_=5 independent experiments; _P_≤0.001 (one-sample _t_-test). (d) FACS analysis of the CD63-GFP content of Raji recipient cells after coculture with J77-CD63GFP cells expressing shnSMase2 or siHrs. Data are the percentage±s.e.m. of Raji-GFP-positive recipient cells relative to the SEE-loaded control condition. _n_=8 independent experiments, *_P_=0.0005 (one-sample _t_-test). (e) Quantitative reverse transcription PCR (qRT–PCR) analysis of miR-335 in Raji cells sorted after conjugation with J-335 cells in the presence of manumycin or brefeldin. _n_=3 independent experiments; *_P_=0.03 (unpaired _t_-test). (f) qRT–PCR analysis of miR-335 in Raji cells sorted after conjugation with J-335 transduced with shnSMase 2 or shControl. _n_=4 independent experiments; *_P_=0.012 (unpaired _t_-test); error bars represent s.e.m.
Figure 7. Synaptically transferred miR-335 downregulates target gene expression in the APC.
(a) Raji cells were transfected with reporter constructs consisting of the luciferase sequence placed upstream of the full-length 3′-UTR of either the miR-335-target gene SOX4 or the control gene UBE2F. Luciferase activity was assayed 24 h after coculture of SEE-loaded Raji with J77-miR-335 cells or control J-101 cells (synaptic transfer) or after addition of derived exosomes to SEE-loaded Raji cells (non-synaptic uptake). (b) Experiments as in a performed with Raji recipient cells expressing the wild-type of mutated seed sequence for miR-335 from the SOX4 3′-UTR. Luciferase activities are shown relative to control incubations with untreated Raji cells. Data are means±s.e.m.; _n_=5 independent experiments, *P<0.05 (Newman–Keuls multiple comparison test). White bars, control; grey bars, synaptic transfer; black bars, non-synaptic transfer.
Similar articles
- Analysis of microRNA and protein transfer by exosomes during an immune synapse.
Villarroya-Beltri C, Gutiérrez-Vázquez C, Sánchez-Madrid F, Mittelbrunn M. Villarroya-Beltri C, et al. Methods Mol Biol. 2013;1024:41-51. doi: 10.1007/978-1-62703-453-1_4. Methods Mol Biol. 2013. PMID: 23719941 - Transfer of extracellular vesicles during immune cell-cell interactions.
Gutiérrez-Vázquez C, Villarroya-Beltri C, Mittelbrunn M, Sánchez-Madrid F. Gutiérrez-Vázquez C, et al. Immunol Rev. 2013 Jan;251(1):125-42. doi: 10.1111/imr.12013. Immunol Rev. 2013. PMID: 23278745 Free PMC article. Review. - What is an immunological synapse?
Rodríguez-Fernández JL, Riol-Blanco L, Delgado-Martín C. Rodríguez-Fernández JL, et al. Microbes Infect. 2010 Jun;12(6):438-45. doi: 10.1016/j.micinf.2010.03.003. Epub 2010 Mar 12. Microbes Infect. 2010. PMID: 20227515 Review. - A Protocol to Study T-Cell Signaling in an Immune Synapse by Microscopy.
Fazil MHUT, Kumar P, Verma NK. Fazil MHUT, et al. Methods Mol Biol. 2019;1930:123-128. doi: 10.1007/978-1-4939-9036-8_15. Methods Mol Biol. 2019. PMID: 30610606 - Immunological synapse-driven transfer of extracellular vesicle microRNAs in primary lymphocytes.
Dosil SG, Rodriguez-Galán A, Sánchez-Madrid F, Fernández-Messina L. Dosil SG, et al. Methods Cell Biol. 2023;178:173-193. doi: 10.1016/bs.mcb.2022.12.004. Epub 2023 Jan 27. Methods Cell Biol. 2023. PMID: 37516525
Cited by
- Regulation of chronic inflammatory and immune processes by extracellular vesicles.
Robbins PD, Dorronsoro A, Booker CN. Robbins PD, et al. J Clin Invest. 2016 Apr 1;126(4):1173-80. doi: 10.1172/JCI81131. Epub 2016 Apr 1. J Clin Invest. 2016. PMID: 27035808 Free PMC article. Review. - CD11c+ myeloid cell exosomes reduce intestinal inflammation during colitis.
Bauer KM, Nelson MC, Tang WW, Chiaro TR, Brown DG, Ghazaryan A, Lee SH, Weis AM, Hill JH, Klag KA, Tran VB, Thompson JW, Ramstead AG, Monts JK, Marvin JE, Alexander M, Voth WP, Stephens WZ, Ward DM, Petrey AC, Round JL, O'Connell RM. Bauer KM, et al. JCI Insight. 2022 Oct 10;7(19):e159469. doi: 10.1172/jci.insight.159469. JCI Insight. 2022. PMID: 36214220 Free PMC article. - Cardiac progenitor-derived exosomes protect ischemic myocardium from acute ischemia/reperfusion injury.
Chen L, Wang Y, Pan Y, Zhang L, Shen C, Qin G, Ashraf M, Weintraub N, Ma G, Tang Y. Chen L, et al. Biochem Biophys Res Commun. 2013 Feb 15;431(3):566-71. doi: 10.1016/j.bbrc.2013.01.015. Epub 2013 Jan 11. Biochem Biophys Res Commun. 2013. PMID: 23318173 Free PMC article. - MicroRNA and Protein Cargos of Human Limbal Epithelial Cell-Derived Exosomes and Their Regulatory Roles in Limbal Stromal Cells of Diabetic and Non-Diabetic Corneas.
Verma N, Khare D, Poe AJ, Amador C, Ghiam S, Fealy A, Ebrahimi S, Shadrokh O, Song XY, Santiskulvong C, Mastali M, Parker S, Stotland A, Van Eyk JE, Ljubimov AV, Saghizadeh M. Verma N, et al. Cells. 2023 Oct 25;12(21):2524. doi: 10.3390/cells12212524. Cells. 2023. PMID: 37947602 Free PMC article. - The Role of Extracellular Vesicles in the Pathogenesis and Treatment of Autoimmune Disorders.
Lu M, DiBernardo E, Parks E, Fox H, Zheng SY, Wayne E. Lu M, et al. Front Immunol. 2021 Feb 24;12:566299. doi: 10.3389/fimmu.2021.566299. eCollection 2021. Front Immunol. 2021. PMID: 33732229 Free PMC article. Review.
References
- Monks C. R. F., Freiberg B. A., Kupfer H., Sclaky N. & Kupfer A. Three-dimensional segregation of supramolecular activation clusters in T cells. Nature 395, 82–86 (1998). - PubMed
- Dustin M. L. A novel adaptor protein orchestrates receptor patterning and cytoskeletal polarity in T-cell contacts. Cell 94, 667–677 (1998). - PubMed
- Kupfer A. & Dennert G. Reorientation of the microtubule-organizing center and the Golgi apparatus in cloned cytotoxic lymphocytes triggered by binding to lysable target cells. J. Immunol. 133, 2762–2766 (1984). - PubMed
- Sancho D. et al.. Regulation of microtubule-organizing center orientation and actomyosin cytoskeleton rearrangement during immune interactions. Immunol. Rev. 189, 84–97 (2002). - PubMed
- Huse M., Lillemeier B. F., Kuhns M. S., Chen D. S. & Davis M. M. T cells use two directionally distinct pathways for cytokine secretion. Nat. Immunol. 7, 247–255 (2006). - PubMed
Publication types
MeSH terms
Substances
LinkOut - more resources
Full Text Sources
Other Literature Sources
Molecular Biology Databases
Miscellaneous


