Enterotypes of the human gut microbiome - PubMed (original) (raw)
. 2011 May 12;473(7346):174-80.
doi: 10.1038/nature09944. Epub 2011 Apr 20.
Jeroen Raes, Eric Pelletier, Denis Le Paslier, Takuji Yamada, Daniel R Mende, Gabriel R Fernandes, Julien Tap, Thomas Bruls, Jean-Michel Batto, Marcelo Bertalan, Natalia Borruel, Francesc Casellas, Leyden Fernandez, Laurent Gautier, Torben Hansen, Masahira Hattori, Tetsuya Hayashi, Michiel Kleerebezem, Ken Kurokawa, Marion Leclerc, Florence Levenez, Chaysavanh Manichanh, H Bjørn Nielsen, Trine Nielsen, Nicolas Pons, Julie Poulain, Junjie Qin, Thomas Sicheritz-Ponten, Sebastian Tims, David Torrents, Edgardo Ugarte, Erwin G Zoetendal, Jun Wang, Francisco Guarner, Oluf Pedersen, Willem M de Vos, Søren Brunak, Joel Doré; MetaHIT Consortium; María Antolín, François Artiguenave, Hervé M Blottiere, Mathieu Almeida, Christian Brechot, Carlos Cara, Christian Chervaux, Antonella Cultrone, Christine Delorme, Gérard Denariaz, Rozenn Dervyn, Konrad U Foerstner, Carsten Friss, Maarten van de Guchte, Eric Guedon, Florence Haimet, Wolfgang Huber, Johan van Hylckama-Vlieg, Alexandre Jamet, Catherine Juste, Ghalia Kaci, Jan Knol, Omar Lakhdari, Severine Layec, Karine Le Roux, Emmanuelle Maguin, Alexandre Mérieux, Raquel Melo Minardi, Christine M'rini, Jean Muller, Raish Oozeer, Julian Parkhill, Pierre Renault, Maria Rescigno, Nicolas Sanchez, Shinichi Sunagawa, Antonio Torrejon, Keith Turner, Gaetana Vandemeulebrouck, Encarna Varela, Yohanan Winogradsky, Georg Zeller, Jean Weissenbach, S Dusko Ehrlich, Peer Bork
Affiliations
- PMID: 21508958
- PMCID: PMC3728647
- DOI: 10.1038/nature09944
Enterotypes of the human gut microbiome
Manimozhiyan Arumugam et al. Nature. 2011.
Erratum in
- Nature. 2011 Jun 30;474(7353):666
- Nature. 2014 Feb 27;506(7489):516
Abstract
Our knowledge of species and functional composition of the human gut microbiome is rapidly increasing, but it is still based on very few cohorts and little is known about variation across the world. By combining 22 newly sequenced faecal metagenomes of individuals from four countries with previously published data sets, here we identify three robust clusters (referred to as enterotypes hereafter) that are not nation or continent specific. We also confirmed the enterotypes in two published, larger cohorts, indicating that intestinal microbiota variation is generally stratified, not continuous. This indicates further the existence of a limited number of well-balanced host-microbial symbiotic states that might respond differently to diet and drug intake. The enterotypes are mostly driven by species composition, but abundant molecular functions are not necessarily provided by abundant species, highlighting the importance of a functional analysis to understand microbial communities. Although individual host properties such as body mass index, age, or gender cannot explain the observed enterotypes, data-driven marker genes or functional modules can be identified for each of these host properties. For example, twelve genes significantly correlate with age and three functional modules with the body mass index, hinting at a diagnostic potential of microbial markers.
Figures
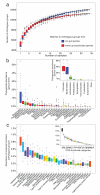
Fig. 1. Functional and phylogenetic profiles of human gut microbiome
(a) Simulation of the detection of distinct orthologous groups (OGs) when increasing the number of individuals (samples). Complete genomes were classified by habitat-information and the OGs divided into those that occur in known gut-species (red) and those that have not yet associated to gut (blue). The former are close to saturation when sampling 35 individuals (excluding infants) whereas functions from non-gut (probably rare and transient) species are not. (b) Genus abundance variation box plot for the 30 most abundant genera as determined by read abundance. Genera are colored by their respective phylum (see inset for color key). Inset: phylum abundance box plot. Genus and phylum level abundances were measured using reference genome based mapping with 85% and 65% sequence similarity cutoffs. Unclassified genera under a higher rank are marked by asterisks. (c) Orthologous group (OG) abundance variation box plot for the 30 most abundant OGs as determined by assignment to eggNOG. OGs are colored by their respective functional category (see inset for color key). Inset: abundance box plot of 24 functional categories.
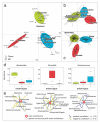
Fig. 2. Phylogenetic differences between enterotypes
Between class analysis, which visualizes results from Principal Component Analysis and clustering, of the genus compositions of (a) 33 Sanger metagenomes estimated by mapping the metagenome reads to 1511 reference genome sequences using an 85% similarity threshold, (b) Danish subset containing 85 metagenomes from a published Illumina dataset and (c) 154 pyrosequencing-based 16S sequences reveal three robust clusters that we call enterotypes. Two principal components are plotted using the ade4 package in R with each sample represented by a filled circle. The center of gravity for each cluster is marked by a rectangle and the colored ellipse covers 67% of the samples belonging to the cluster. (d) Abundances of the main contributors of each enterotype from the Sanger metagenomes. (e) Co-occurrence networks of the three enterotypes from the Sanger metagenomes. Unclassified genera under a higher rank are marked by asterisks in (b) and (e).
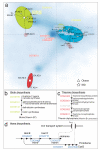
Fig. 3. Functional differences between enterotypes
(a) Between class analysis (see Fig. 2) of orthologous group (OG) abundances showing only minor disagreements with enterotypes (transparent circles indicate the differing samples). The blue cloud represents the local density estimated from the coordinates of OGs; positions of selected OGs are highlighted. (b) Four enzymes in the biotin biosynthesis pathway (COG0132, COG0156, COG0161 and COG0502) are overrepresented in enterotype 1. (c) Four enzymes in the thiamine biosynthesis pathway (COG0422, COG0351, COG0352 and COG0611) are overrepresented in enterotype 2. (d) Six enzymes in the heme biosynthesis pathway (COG0007, COG0276, COG407, COG0408, COG0716 and COG1648) are overrepresented in enterotype 3.
Fig. 4. Correlations with host properties
(a) Pairwise correlation of RNA polymerase facultative sigma24 subunit (COG1595) with age (p=0.03, rho=−0.59). (b) Pairwise correlation of SusD, a family of proteins that bind glycan molecules before they are transported into the cell, and body mass index (p=0.27, rho=−0.29, weak correlation). (c) Multiple OGs (COG0085, COG0086, COG0438 and COG0739; see Supplementary Table 18) significantly correlating with age when combined into a linear model (see Supplementary Methods Section 13 and ref. for details; p= 2.75e-05, adjusted R2=0.57). (d) Two modules, ATPase complex and ectoine biosynthesis (M00051), significantly correlating with BMI when combined into a linear model (p= 6.786e-06, adjusted R2=0.82).
Similar articles
- Diversity and enterotype in gut bacterial community of adults in Taiwan.
Liang C, Tseng HC, Chen HM, Wang WC, Chiu CM, Chang JY, Lu KY, Weng SL, Chang TH, Chang CH, Weng CT, Wang HM, Huang HD. Liang C, et al. BMC Genomics. 2017 Jan 25;18(Suppl 1):932. doi: 10.1186/s12864-016-3261-6. BMC Genomics. 2017. PMID: 28198673 Free PMC article. - A metagenomic approach to dissect the genetic composition of enterotypes in Han Chinese and two Muslim groups.
Li J, Fu R, Yang Y, Horz HP, Guan Y, Lu Y, Lou H, Tian L, Zheng S, Liu H, Shi M, Tang K, Wang S, Xu S. Li J, et al. Syst Appl Microbiol. 2018 Jan;41(1):1-12. doi: 10.1016/j.syapm.2017.09.006. Epub 2017 Nov 10. Syst Appl Microbiol. 2018. PMID: 29129355 - Enterotypes in the landscape of gut microbial community composition.
Costea PI, Hildebrand F, Arumugam M, Bäckhed F, Blaser MJ, Bushman FD, de Vos WM, Ehrlich SD, Fraser CM, Hattori M, Huttenhower C, Jeffery IB, Knights D, Lewis JD, Ley RE, Ochman H, O'Toole PW, Quince C, Relman DA, Shanahan F, Sunagawa S, Wang J, Weinstock GM, Wu GD, Zeller G, Zhao L, Raes J, Knight R, Bork P. Costea PI, et al. Nat Microbiol. 2018 Jan;3(1):8-16. doi: 10.1038/s41564-017-0072-8. Epub 2017 Dec 18. Nat Microbiol. 2018. PMID: 29255284 Free PMC article. Review. - Driving gut microbiota enterotypes through host genetics.
Larzul C, Estellé J, Borey M, Blanc F, Lemonnier G, Billon Y, Thiam MG, Quinquis B, Galleron N, Jardet D, Lecardonnel J, Plaza Oñate F, Rogel-Gaillard C. Larzul C, et al. Microbiome. 2024 Jun 28;12(1):116. doi: 10.1186/s40168-024-01827-8. Microbiome. 2024. PMID: 38943206 Free PMC article. - Application of metagenomics in the human gut microbiome.
Wang WL, Xu SY, Ren ZG, Tao L, Jiang JW, Zheng SS. Wang WL, et al. World J Gastroenterol. 2015 Jan 21;21(3):803-14. doi: 10.3748/wjg.v21.i3.803. World J Gastroenterol. 2015. PMID: 25624713 Free PMC article. Review.
Cited by
- Targeting the Intestinal Microbiota: A Novel Direction in the Treatment of Inflammatory Bowel Disease.
Zhang J, Gan H, Duan X, Li G. Zhang J, et al. Biomedicines. 2024 Oct 15;12(10):2340. doi: 10.3390/biomedicines12102340. Biomedicines. 2024. PMID: 39457652 Free PMC article. Review. - The gut microbiota is associated with the small intestinal paracellular permeability and the development of the immune system in healthy children during the first two years of life.
Kaczmarczyk M, Löber U, Adamek K, Węgrzyn D, Skonieczna-Żydecka K, Malinowski D, Łoniewski I, Markó L, Ulas T, Forslund SK, Łoniewska B. Kaczmarczyk M, et al. J Transl Med. 2021 Apr 28;19(1):177. doi: 10.1186/s12967-021-02839-w. J Transl Med. 2021. PMID: 33910577 Free PMC article. - Bacterial Compositional Shifts of Gut Microbiomes in Patients with Rheumatoid Arthritis in Association with Disease Activity.
El Menofy NG, Ramadan M, Abdelbary ER, Ibrahim HG, Azzam AI, Ghit MM, Ezz AS, Gazar YA, Salah M. El Menofy NG, et al. Microorganisms. 2022 Sep 11;10(9):1820. doi: 10.3390/microorganisms10091820. Microorganisms. 2022. PMID: 36144422 Free PMC article. - The gut microbiome in cardio-metabolic health.
Hansen TH, Gøbel RJ, Hansen T, Pedersen O. Hansen TH, et al. Genome Med. 2015 Mar 31;7(1):33. doi: 10.1186/s13073-015-0157-z. eCollection 2015. Genome Med. 2015. PMID: 25825594 Free PMC article. Review. - Mapping the New World of Necrotizing Enterocolitis (NEC): Review and Opinion.
Gordon P, Christensen R, Weitkamp JH, Maheshwari A. Gordon P, et al. EJ Neonatol Res. 2012;2(4):145-172. EJ Neonatol Res. 2012. PMID: 23730536 Free PMC article.
References
- Hayashi H, Sakamoto M, Benno Y. Phylogenetic Analysis of the Human Gut Microbiota Using 16S rDNA Clone Libraries and Strictly Anaerobic Culture-Based Methods. MICROBIOLOGY and IMMUNOLOGY. 2002;46:535. - PubMed
Publication types
MeSH terms
Substances
LinkOut - more resources
Full Text Sources
Other Literature Sources


