The hypoxia-associated factor switches cells from HIF-1α- to HIF-2α-dependent signaling promoting stem cell characteristics, aggressive tumor growth and invasion - PubMed (original) (raw)
The hypoxia-associated factor switches cells from HIF-1α- to HIF-2α-dependent signaling promoting stem cell characteristics, aggressive tumor growth and invasion
Mei Yee Koh et al. Cancer Res. 2011.
Abstract
Most solid tumors and their metastases experience periods of low oxygen or hypoxia, which is of major clinical significance as it promotes both tumor progression and resistance to therapy. Critical mediators of the hypoxic response are the hypoxia-inducible factors HIF-1α and HIF-2α. The HIFs are nonredundant and regulate both overlapping and unique downstream target genes. Here, we describe a novel mechanism for the switch between HIF-1α- and HIF-2α-dependent transcription during tumor hypoxia caused by the hypoxia associated factor (HAF). HAF is overexpressed in a variety of tumors and its levels are decreased during acute hypoxia, but increased following prolonged hypoxia. We have previously identified HAF as an E3 ubiquitin ligase that binds and ubiquitinates HIF-1α by an oxygen and pVHL-independent mechanism, thus targeting HIF-1α for proteasomal degradation. Here, we show that HAF also binds to HIF-2α, but at a different site than HIF-1α, and increases HIF-2α transactivation without causing its degradation. HAF, thus, switches the hypoxic response of the cancer cell from HIF-1α-dependent to HIF-2α-dependent transcription and activates genes involved in invasion such as MMP9, PAI-1, and the stem cell factor OCT-3/4. The switch to HIF-2α-dependent gene expression caused by HAF also promotes an enriched tumor stem cell population, resulting in highly aggressive tumors in vivo. Thus, HAF, by causing a switch from a HIF-1α- to HIF-2α-dependent response to hypoxia, provides a mechanism for more aggressive growth of tumors under prolonged hypoxia.
Conflict of interest statement
Disclosure of Potential Conflicts of Interest
No potential conflicts of interest were disclosed.
Figures
Figure 1
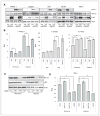
The effect of HAF overexpression on levels and activity of HIF-1α and HIF-2α. A, Western blots showing the effect of FLAG-HAF overexpression on HIF-1α and HIF-2α levels in normoxia or hypoxia. B, the effect of HAF overexpression on HRE-Luciferase (Luc) activity normalized to constitutive Renilla Luc. C, Western blot showing the effect of HIF-1α, HIF-2α, or HAF siRNA transfection on HIF-2α and HAF levels with accompanying HRE-luc activity (D) in 786-0 cells stably expressing HRE-Luc and Renilla Luc. Results shown as relative light units (RLU) of a representative experiment from at least 3 independent experiments and are the mean ± SE (*, P < 0.05).
Figure 2
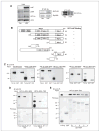
Mapping of the HAF–HIF-2α interaction domains. A, Western blot showing the co-IP of FLAG-HAF with HIF-2α and vice versa in U87 cells stably overexpressing FLAG-HAF. B, schematic diagram showing HIF-2α deletion mutants used in pull down assays and their ability to bind GST-HAF as detected by Western blot. C, Western blots showing results of pull down assays depicted in B. The binding of GST-HAF to V5-HIF-2α was detected by using anti-V5 antibodies. D, Western blot showing the results of pull down assays by using GST-HAF (full length, FL), GST-HAF 1–422 (N-terminus, NT), or GST-HAF 396–800 (C-terminus, CT) and in vitro transcribed/translated V5-HIF-2α deletion mutants. E, mapping of the HAF-binding region of HIF-2α (604–750). HAF truncations: FL – full length; 1–HAF (200–600); 2–HAF (300–600); 3–HAF (200—500); 4–HAF (300–500). IB, immunoblotting.
Figure 3
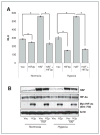
The effect of inhibition of HAF–HIF-2α binding on HIF-2α transactivation. A, HRE-Luciferase assay showing the effect of inhibition of the HAF–HIF-2α interaction by overexpression of HIF-2α (604–750; HIF2p) on endogenous and HAF-induced HRE activity in 786-0 cells. Cells were transiently transfected (equal total DNA transfected in each condition) for 48 hours and then incubated for a further 16 hours in normoxia or hypoxia. Results are the mean of a representative experiment from at least 2 independent experiments ± SE. *, P < 0.05. B, Western blot for representative experiment. RLU, relative light units.
Figure 4
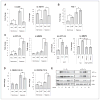
HAF overexpression shifts cells from HIF-1α– to HIF-2α–dependent transcription. TaqMan qRT-PCR showing the effects of HAF overexpression on transcription of A, HIF-1α–dependent genes (i) CAIX and (ii) DDIT4; B, the HIF-2α–specific target PAI-1 after 16 hours 1% O2; and C, (i) OCT-3/4 and (ii) MMP9 after 72 hours 1% O2. C, iii and iv, the effects of HAF overexpression on OCT-3/4 and MMP9 after transfection with Scr nontargeting control or HIF-2α siRNA (siH2) after 72 hours 1% O2. siH2_2 and siH2_4 denote different siRNA duplexes. D, TaqMan qRT-PCR showing the effects of hypoxic duration on the HAF-induced modulation of VEGFA transcription. Data were obtained in U87 cells with similar results in LN229 cells and are the mean of at least 3 independent experiments ± SE. *, P < 0.05. E, Western blot showing the effects of hypoxic durations and intensities on levels of HIF-1α, HIF-2α, and HAF in U87 cells. Western data are representative of at least 3 separate experiments.
Figure 5
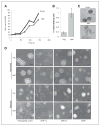
Downstream effects of the HAF-mediated switch from HIF-1α to HIF-2α. A, growth curve of U87 cells in regular culture in normoxia. B, numbers of floating versus adherent cells in HAF and vector U87 cells. Viability was determined by trypan blue exclusion. *, P < 0.05. C, 3D colony appearance of vector or HAF U87 cells in Matrigel-coated chamber slides after 72 hours hypoxia (1% O2). D, 3D colony appearance of vector or HAF U87 cells grown on NanoCulture 96-well plates after 72 hours normoxia or hypoxia ± siRNA transfection. Images were taken with a 40× objective and are representative of at least 4 replicate wells with 6 fields taken per well. Scale bars indicate 100 μm.
Figure 6
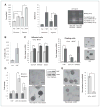
Effect of HAF overexpression on invasion and self-renewal. A, effect of HAF overexpression on invasion through Matrigel- (L) or Laminin I–coated (R) transwell membranes, respectively. Inset, Zymogram assay by using supernatants of cells grown in normoxia or hypoxia. B, % CD133+ cells in vector or HAF overexpressing U87 cells as determined by fluorescence-activated cell sorting analysis. C, levels of indicated stem cell markers in HAF relative to vector U87 adherent or floating cells, respectively, as determined by TaqMan qRT-PCR. Photos of neurospheres generated by continuous culture of HAF or vector U87 floating cells in neurobasal media are shown inset. D, levels of HAF, OCT3/4, and NANOG in U87 neurospheres generated by continuous culture in neurobasal media normalized to cells grown in regular media with representative photomicrographs (arrow indicates neurosphere) and Western blots. E, the effect of control or HAF siRNA transfection on neurosphere formation. Data are the mean of at least 2 independent experiments ± SE. Scale bars indicate 100 μm; *, P < 0.05.
Figure 7
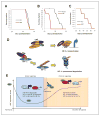
Effect of HAF on tumor growth in vivo. A, survival curve when 500,000 vector or HAF U87 cells (adherent population only) were injected intracranially. B and C, survival curve of mice injected intracranially with 100,000 or 5,000 pooled floating and adherent cell populations (*, P = 0.00425). D, diagram showing mechanism of the HAF-induced switch from HIF-1α to HIF-2α signaling. The C-terminal E3 ubiquitin ligase domain of HAF binds to HIF-1α close to its oxygen-dependent degradation domain (ODD) and ubiquitinates it, targeting it for proteasomal degradation, whereas the central domain of HAF binds close to the C-TAD of HIF-2α, hence promoting HIF-2α transactivation. E, diagram showing the proposed role of HAF in regulating the kinetics of the HIF-1/2α activation in response to continuous hypoxia. During the early/acute hypoxic response, HAF protein levels decrease which facilitates the activation of HIF-1α but limits HIF-2α–dependent transcription. During prolonged/chronic hypoxia, HAF levels gradually increase in which it cooperates with HIF-2α to promote transcription.
Comment in
- Hypoxia: HIF switch.
Seton-Rogers S. Seton-Rogers S. Nat Rev Cancer. 2011 Jun;11(6):391. doi: 10.1038/nrc3074. Nat Rev Cancer. 2011. PMID: 21606940 No abstract available.
Similar articles
- HAF drives the switch of HIF-1α to HIF-2α by activating the NF-κB pathway, leading to malignant behavior of T24 bladder cancer cells.
Guan Z, Ding C, Du Y, Zhang K, Zhu JN, Zhang T, He D, Xu S, Wang X, Fan J. Guan Z, et al. Int J Oncol. 2014 Feb;44(2):393-402. doi: 10.3892/ijo.2013.2210. Epub 2013 Dec 6. Int J Oncol. 2014. PMID: 24316875 Free PMC article. - Hypoxia-associated factor, a novel E3-ubiquitin ligase, binds and ubiquitinates hypoxia-inducible factor 1alpha, leading to its oxygen-independent degradation.
Koh MY, Darnay BG, Powis G. Koh MY, et al. Mol Cell Biol. 2008 Dec;28(23):7081-95. doi: 10.1128/MCB.00773-08. Epub 2008 Oct 6. Mol Cell Biol. 2008. PMID: 18838541 Free PMC article. - HAF : the new player in oxygen-independent HIF-1alpha degradation.
Koh MY, Powis G. Koh MY, et al. Cell Cycle. 2009 May 1;8(9):1359-66. doi: 10.4161/cc.8.9.8303. Cell Cycle. 2009. PMID: 19377289 Free PMC article. Review. - Hypoxia induced CCR7 expression via HIF-1alpha and HIF-2alpha correlates with migration and invasion in lung cancer cells.
Li Y, Qiu X, Zhang S, Zhang Q, Wang E. Li Y, et al. Cancer Biol Ther. 2009 Feb;8(4):322-30. doi: 10.4161/cbt.8.4.7332. Epub 2009 Feb 3. Cancer Biol Ther. 2009. PMID: 19305150 - Multiplicity of hypoxia-inducible transcription factors and their connection to the circadian clock in the zebrafish.
Pelster B, Egg M. Pelster B, et al. Physiol Biochem Zool. 2015 Mar-Apr;88(2):146-57. doi: 10.1086/679751. Epub 2015 Jan 14. Physiol Biochem Zool. 2015. PMID: 25730270 Review.
Cited by
- Hypoxia enhances cholangiocarcinoma invasion through activation of hepatocyte growth factor receptor and the extracellular signal‑regulated kinase signaling pathway.
Vanichapol T, Leelawat K, Hongeng S. Vanichapol T, et al. Mol Med Rep. 2015 Sep;12(3):3265-3272. doi: 10.3892/mmr.2015.3865. Epub 2015 May 27. Mol Med Rep. 2015. PMID: 26018028 Free PMC article. - Relative quantitative expression of hypoxia-inducible factor-1α, -2α and -3α, and vascular endothelial growth factor A in laryngeal carcinoma.
Popov TM, Goranova T, Stancheva G, Kaneva R, Dikov T, Chalakov I, Rangachev J, Konov D, Todorov S, Stoyanov O, Mitev V. Popov TM, et al. Oncol Lett. 2015 Jun;9(6):2879-2885. doi: 10.3892/ol.2015.3070. Epub 2015 Mar 24. Oncol Lett. 2015. PMID: 26137164 Free PMC article. - HIF1α and HIF2α: sibling rivalry in hypoxic tumour growth and progression.
Keith B, Johnson RS, Simon MC. Keith B, et al. Nat Rev Cancer. 2011 Dec 15;12(1):9-22. doi: 10.1038/nrc3183. Nat Rev Cancer. 2011. PMID: 22169972 Free PMC article. Review. - HIF1α/HIF2α-Sox2/Klf4 promotes the malignant progression of glioblastoma via the EGFR-PI3K/AKT signalling pathway with positive feedback under hypoxia.
Wang P, Zhao L, Gong S, Xiong S, Wang J, Zou D, Pan J, Deng Y, Yan Q, Wu N, Liao B. Wang P, et al. Cell Death Dis. 2021 Mar 24;12(4):312. doi: 10.1038/s41419-021-03598-8. Cell Death Dis. 2021. PMID: 33762574 Free PMC article. - The hypoxia-inducible factor-1α in stemness and resistance to chemotherapy in gastric cancer: Future directions for therapeutic targeting.
Ozcan G. Ozcan G. Front Cell Dev Biol. 2023 Feb 8;11:1082057. doi: 10.3389/fcell.2023.1082057. eCollection 2023. Front Cell Dev Biol. 2023. PMID: 36846589 Free PMC article. Review.
References
- Vaupel P, Mayer A. Hypoxia in cancer: significance and impact on clinical outcome. Cancer Metastasis Rev. 2007;26:225–39. - PubMed
- Singh SK, Hawkins C, Clarke ID, Squire JA, Bayani J, Hide T, et al. Identification of human brain tumour initiating cells. Nature. 2004;432:396–401. - PubMed
- Thiery JP, Acloque H, Huang RY, Nieto MA. Epithelial-mesenchymal transitions in development and disease. Cell. 2009;139:871–90. - PubMed
- Koh MY, Spivak-Kroizman TR, Powis G. HIF-1alpha and cancer therapy. Recent Results Cancer Res. 2010;180:15–34. - PubMed
Publication types
MeSH terms
Substances
Grants and funding
- P50 CA127001-05/CA/NCI NIH HHS/United States
- R01 CA098920/CA/NCI NIH HHS/United States
- P50 CA095060/CA/NCI NIH HHS/United States
- CA095060/CA/NCI NIH HHS/United States
- CA17094/CA/NCI NIH HHS/United States
- P01 CA017094/CA/NCI NIH HHS/United States
- CA098920/CA/NCI NIH HHS/United States
- P50 CA127001/CA/NCI NIH HHS/United States
- R01 CA098920-08/CA/NCI NIH HHS/United States
- P50 CA095060-07/CA/NCI NIH HHS/United States
- P01 CA017094-27/CA/NCI NIH HHS/United States
- CA127001/CA/NCI NIH HHS/United States
LinkOut - more resources
Full Text Sources
Other Literature Sources
Molecular Biology Databases
Miscellaneous
