The lineage-defining factors T-bet and Bcl-6 collaborate to regulate Th1 gene expression patterns - PubMed (original) (raw)
The lineage-defining factors T-bet and Bcl-6 collaborate to regulate Th1 gene expression patterns
Kenneth J Oestreich et al. J Exp Med. 2011.
Abstract
The T-box transcription factor T-bet is important for the differentiation of naive CD4(+) T helper cells (Th cells) into the Th1 phenotype. Much is known about T-bet's role as a transcriptional activator, but less is known about the mechanisms by which T-bet functionally represses alternative Th cell genetic programs. In this study, we first identify Socs1, Socs3, and Tcf7 (TCF-1) as gene targets that are negatively regulated by T-bet. Significantly, T-bet's role in the repression of these genes is through a direct interaction with their promoters. Consistent with this, we identified two T-bet DNA-binding elements in the Socs1 promoter that are functionally used to down-regulate transcription in primary Th1 cells. Importantly, T-bet's novel role in transcriptional repression is because of its ability to physically associate with, and functionally recruit, the transcriptional repressor Bcl-6 to a subset of promoters. Furthermore, T-bet functionally recruits Bcl-6 to the Ifng locus in late stages of Th1 differentiation to repress its activity, possibly to prevent the overproduction of IFN-γ, which could result in autoimmunity. Collectively, these data establish a novel mechanism for T-bet-mediated gene repression in which two lineage-defining transcription factors, one a classical activator and one a repressor, collaborate to promote and properly regulate Th1 development.
Figures
Figure 1.
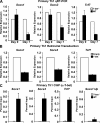
T-bet binds to and represses the transcription of Socs1, Socs3, and Tcf7. (A) RNA was isolated from WT and T-bet–deficient primary CD4+ T cells either directly ex vivo or after polarization in Th1 conditions for 7 d. Socs1, Socs3, and Tcf7 transcript levels were analyzed by quantitative RT-PCR. Results were normalized to the values obtained for Actb and are expressed as a ratio relative to the T-bet−/− sample. (B) RNA was isolated from T-bet−/− CD4+ T cells transduced with an empty expression vector or one containing T-bet. Transcript levels were determined by quantitative RT-PCR, and the data were normalized and represented as in A. (C) T-bet association with the promoters of Socs1, Socs3, and Tcf7 was assessed by ChIP. Chromatin was isolated from either WT or T-bet−/− CD4+ T cells stimulated under Th1 conditions for 7 d. Chromatin samples were immunoprecipitated with antibodies to T-bet or a nonspecific antibody control. After purification, immunoprecipitated DNA was quantitated by qPCR. qPCR signals were normalized to the nonspecific antibody control as well as a standardized aliquot of the input chromatin. (A–C) Data represent the mean of three (A and B) or five (C) independent experiments (error bars indicate SEM).
Figure 2.
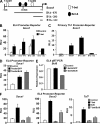
The T-bet–dependent repression of Socs1, Socs3, and Tcf7 is independent of the chromatin environment and requires a corepressor. (A) H3K4me2 levels at the promoters of Socs1, Socs3, Tcf7, and Ifng were assessed by ChIP. Chromatin was isolated from either WT or T-bet−/− CD4+ T cells skewed in Th1 conditions. Chromatin samples were immunoprecipitated with antibodies specific to the H3K4me2 mark or a nonspecific antibody control and quantitated as described in Fig. 1. (B) T-bet–dependent promoter-luciferase reporter activity was examined for Socs1, Socs3, Tcf7, and Ifng. EL4 T cells were transfected with the indicated pGL3 promoter-reporter construct and either an empty vector control (Cont.) or a T-bet expression plasmid. After P/I stimulation, luciferase values were measured and normalized to the activity obtained for a cotransfected renilla control. (A and B) Data represent the mean of four (A) or six (B) independent experiments (error bars indicate SEM). RLU, relative light units.
Figure 3.
Bcl-6 represses the promoter activity of Socs1, Socs3, and Tcf7. (A) The schematic indicates the location of predicted T-bet binding sites in the Socs1 promoter as well as the Socs1 truncation mutant constructs (see
Fig. S3
for precise location). (B and C) EL4 (B) or primary WT Th1 (C) cells were transfected with the indicated Socs1 truncation or full-length promoter-reporter construct. In addition, EL4 cells were cotransfected with either an empty expression vector (control) or one expressing T-bet. Luciferase reporter activity was normalized to the activity obtained for the cotransfected renilla control. (D) EL4 cells were transfected with the Socs1 promoter-reporter in conjunction with a control or T-bet expression vector and a control siRNA (siGFP) or one specific to Bcl-6 (siBcl6). After P/I stimulation, luciferase promoter-reporter values were normalized to the renilla control. (E) EL4 cells were transfected and treated as in D. RNA was isolated, and Bcl6 transcript levels were analyzed by quantitative RT-PCR. Results were normalized to the values obtained for Actb and are expressed as a ratio relative to the control sample. (F) EL4 T cells were cotransfected with the indicated pGL3 promoter-reporter construct and an empty vector control, T-bet, Bcl-6, or T-bet and Bcl-6 in combination. After P/I stimulation, luciferase promoter-reporter values were normalized to the renilla control. (B–F) Data represent the mean of three (B–E) or four (F) independent experiments (error bars indicate SEM). RLU, relative light units.
Figure 4.
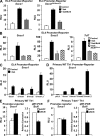
Bcl-6–dependent repression of Socs1, Socs3, and Tcf7 is independent of Bcl-6 DNA binding. (A) The Socs1Bcl6mut1,2 or WT promoter-reporter constructs were cotransfected with an empty expression vector (control), T-bet, or T-bet and Bcl-6. (See
Fig. S3
for precise location of the Bcl-6 binding site mutations in the Socs1Bcl6mut1,2 construct.) (B) EL4 T cells were transfected with the indicated pGL3 promoter construct and an empty vector control, T-bet, T-bet and Bcl-6, or T-bet and the Bcl-6 DNA-binding mutant (Bcl6DBmut). (C) The indicated Socs1 point mutants (in T-bet binding sites) or WT promoter-reporter constructs were cotransfected with either an empty expression vector (control) or one expressing T-bet. (A–C) The samples were stimulated with P/I, and the reporter activity was measured and normalized to the activity of a renilla control. (D) The indicated Socs1 point mutant (in T-bet binding sites) or WT promoter-reporter constructs were transfected into primary WT Th1 cells. After overnight incubation, reporter activity was measured and normalized to a renilla control. (E and F) Primary WT (E) or T-bet−/− (F) Th1 cells were transfected with the Socs1 promoter-reporter and either a control siRNA (siGFP) or one specific to Bcl-6 (siBcl6). Luciferase promoter-reporter values were normalized to the renilla control. RNA was isolated from the primary Th1 cells, and Bcl6 transcript levels were analyzed by quantitative RT-PCR. Results were normalized to the values obtained for Actb and are expressed as a ratio relative to the control sample. (A–F) Data represent the mean of three (A and D) or four (B, C, E, and F) independent experiments (error bars indicate SEM). RLU, relative light units.
Figure 5.
Bcl-6 is recruited to the promoters of Socs1, Socs3, and Tcf7 through a physical interaction with T-bet in Th1 cells. (A) Chromatin was isolated from either WT or T-bet−/− CD4+ T cells stimulated in Th1 conditions for 7 d. Chromatin samples were immunoprecipitated with either an antibody to Bcl-6 or a nonspecific antibody control. Immunoprecipitated DNA was quantitated by qPCR and normalized to the nonspecific antibody control as well as a standardized aliquot of the input chromatin. Data represent the mean of five independent experiments (error bars indicate SEM). (B) EL4 T cells were transfected with an untagged T-bet expression construct in combination with either a V5 epitope–tagged Bcl-6 expression vector or empty vector control. Lysates were prepared and immunoprecipitated with an antibody for the V5 epitope tag and then probed with a T-bet–specific antibody. (C) Lysates from either WT or T-bet−/− primary Th1 cells were immunoprecipitated with either a Bcl-6 (lanes 5 and 6) or control antibody (lane 4). After IP, a Western blot analysis was performed with a T-bet–specific antibody. (B and C) Data are representative of three (B) or five (C) independent experiments. IB, immunoblot.
Figure 6.
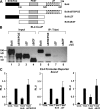
The C-terminal zinc finger domain of Bcl-6 is required for its association with T-bet. (A) The schematic indicates the location of the primary functional domains contained within Bcl-6. These include an N-terminal BTB/POZ domain, a C-terminal domain containing six individual zinc fingers (displayed as gray ovals), and a centrally located PEST domain. Diagrams of the Bcl-6 truncation mutant constructs are shown below the WT schematic. (B) EL4 T cells were transfected with an untagged T-bet expression construct in combination with V5 epitope–tagged WT Bcl-6 (lanes 1 and 5) or the Bcl-6 truncation mutant expression vectors as indicated (lanes 2–4 and 6–8). Lysates were prepared and immunoprecipitated with an antibody to T-bet (lanes 5–8). The blot was then probed with a V5 epitope tag–specific antibody. Data are representative of three independent experiments. (C) EL4 T cells were transfected with the full-length Socs1 promoter-reporter construct and an empty vector control, T-bet, T-bet and Bcl-6, or T-bet and the indicated Bcl-6 truncation mutants. After P/I stimulation, luciferase promoter-reporter values were normalized to the renilla control. Data represent the mean of three independent experiments (error bars indicate SEM). IB, immunoblot; RLU, relative light units.
Figure 7.
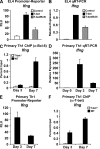
T-bet–dependent recruitment of Bcl-6 to the Ifng promoter in late time points of Th1 culture correlates with a reduction in Ifng gene transcription. (A) EL4 T cells were cotransfected with the indicated pGL3 promoter-reporter construct and an empty expression vector control, T-bet, or T-bet and Bcl-6. After P/I stimulation, luciferase values were measured and normalized to a renilla control. (B) EL4 T cells were transfected and treated as in A followed by RNA isolation. A quantitative RT-PCR analysis to determine endogenous Ifng transcript levels was performed and normalized to Actb. (C) Chromatin was isolated from either WT or T-bet−/− CD4+ T cells at day 3 or 7 of Th1 differentiation. Chromatin samples were immunoprecipitated with either an antibody to Bcl-6 or a nonspecific antibody control. Immunoprecipitated DNA was quantitated by qPCR with signals for the Ifng promoter normalized to the nonspecific antibody control as well as a standardized aliquot of the input chromatin. (D) RNA samples were isolated from WT CD4+ T cells at days 3 and 7 of Th1 differentiation. A quantitative RT-PCR analysis was performed to determine Ifng transcript levels, and results were normalized to Actb. The data are represented as fold change over the Ifng transcript levels at day 0. (E) The Ifng promoter-reporter construct was transfected into primary Th1 cells at days 3 and 7 of Th1 differentiation. After overnight incubation, luciferase values were measured and normalized to both empty vector (pGL3) and renilla controls. (F) ChIP samples were treated and analyzed as in C with the exception that a T-bet antibody was used for IP. (A–F) Data represent the mean of four (A, C, and F) or three (B, D, and E) independent experiments (error bars indicate SEM). RLU, relative light units.
Figure 8.
Models representing the mechanisms by which T-bet and Bcl-6 cooperate to regulate transcription. (A) Schematic portraying the differences in the regulation of Socs1, Socs3, and Tcf7 genes in WT versus T-bet–deficient CD4+ T cells. In WT Th1 cells, T-bet–dependent targeting of Bcl-6 to the Socs1, Socs3, and Tcf7 promoters results in transcriptional repression. Conversely, the absence of T-bet in the T-bet−/− Th1 cells results in a loss of Bcl-6 targeting to the Socs1, Socs3, and Tcf7 promoters and gene activation. (B) A schematic representation of Bcl-6 repression at the Ifng locus. In the naive CD4+ T cells, gray circles represent closed chromatin. By day 3 of Th1 differentiation, T-bet binds to the promoter and functionally induces chromatin remodeling, resulting in enhanced Ifng transcription. By day 7 of Th1 differentiation, the reduced level of Ifng transcription correlates with the T-bet–dependent recruitment of Bcl-6 to the Ifng promoter.
Similar articles
- Molecular mechanisms that control the expression and activity of Bcl-6 in TH1 cells to regulate flexibility with a TFH-like gene profile.
Oestreich KJ, Mohn SE, Weinmann AS. Oestreich KJ, et al. Nat Immunol. 2012 Mar 11;13(4):405-11. doi: 10.1038/ni.2242. Nat Immunol. 2012. PMID: 22406686 Free PMC article. - Transient T-bet expression functionally specifies a distinct T follicular helper subset.
Fang D, Cui K, Mao K, Hu G, Li R, Zheng M, Riteau N, Reiner SL, Sher A, Zhao K, Zhu J. Fang D, et al. J Exp Med. 2018 Nov 5;215(11):2705-2714. doi: 10.1084/jem.20180927. Epub 2018 Sep 19. J Exp Med. 2018. PMID: 30232200 Free PMC article. - T-bet regulates Th1 responses through essential effects on GATA-3 function rather than on IFNG gene acetylation and transcription.
Usui T, Preiss JC, Kanno Y, Yao ZJ, Bream JH, O'Shea JJ, Strober W. Usui T, et al. J Exp Med. 2006 Mar 20;203(3):755-66. doi: 10.1084/jem.20052165. Epub 2006 Mar 6. J Exp Med. 2006. PMID: 16520391 Free PMC article. - Molecular mechanisms by which T-bet regulates T-helper cell commitment.
Miller SA, Weinmann AS. Miller SA, et al. Immunol Rev. 2010 Nov;238(1):233-46. doi: 10.1111/j.1600-065X.2010.00952.x. Immunol Rev. 2010. PMID: 20969596 Free PMC article. Review. - The role of protein modifications of T-bet in cytokine production and differentiation of T helper cells.
Oh S, Hwang ES. Oh S, et al. J Immunol Res. 2014;2014:589672. doi: 10.1155/2014/589672. Epub 2014 May 13. J Immunol Res. 2014. PMID: 24901011 Free PMC article. Review.
Cited by
- IFN-γ promotes the development of systemic lupus erythematosus through the IFNGR1/2-PSTAT1-TBX21 signaling axis.
Chen Y, Tian B. Chen Y, et al. Am J Transl Res. 2022 Oct 15;14(10):6874-6888. eCollection 2022. Am J Transl Res. 2022. PMID: 36398225 Free PMC article. - Exploring TCR-like CAR-Engineered Lymphocyte Cytotoxicity against MAGE-A4.
Alsalloum A, Shevchenko J, Fisher M, Philippova J, Perik-Zavodskii R, Perik-Zavodskaia O, Alrhmoun S, Lopatnikova J, Vasily K, Volynets M, Zavjalov E, Solovjeva O, Akahori Y, Shiku H, Silkov A, Sennikov S. Alsalloum A, et al. Int J Mol Sci. 2023 Oct 13;24(20):15134. doi: 10.3390/ijms242015134. Int J Mol Sci. 2023. PMID: 37894816 Free PMC article. - Making memories with Bcl-6.
Read KA, Oestreich KJ. Read KA, et al. J Exp Med. 2022 Jan 3;219(1):e20212177. doi: 10.1084/jem.20212177. Epub 2021 Nov 18. J Exp Med. 2022. PMID: 34792529 Free PMC article. - ZBTB Transcription Factors: Key Regulators of the Development, Differentiation and Effector Function of T Cells.
Cheng ZY, He TT, Gao XM, Zhao Y, Wang J. Cheng ZY, et al. Front Immunol. 2021 Jul 19;12:713294. doi: 10.3389/fimmu.2021.713294. eCollection 2021. Front Immunol. 2021. PMID: 34349770 Free PMC article. Review. - Vaccine adjuvant-elicited CD8+ T cell immunity is co-dependent on T-bet and FOXO1.
Ivanova DL, Thompson SB, Klarquist J, Harbell MG, Kilgore AM, Lasda EL, Hesselberth JR, Hunter CA, Kedl RM. Ivanova DL, et al. Cell Rep. 2023 Aug 29;42(8):112911. doi: 10.1016/j.celrep.2023.112911. Epub 2023 Jul 29. Cell Rep. 2023. PMID: 37516968 Free PMC article.
References
- Alexander W.S., Starr R., Fenner J.E., Scott C.L., Handman E., Sprigg N.S., Corbin J.E., Cornish A.L., Darwiche R., Owczarek C.M., et al. 1999. SOCS1 is a critical inhibitor of interferon gamma signaling and prevents the potentially fatal neonatal actions of this cytokine. Cell. 98:597–608 10.1016/S0092-8674(00)80047-1 - DOI - PubMed
- Chong M.M., Chen Y., Darwiche R., Dudek N.L., Irawaty W., Santamaria P., Allison J., Kay T.W., Thomas H.E. 2004. Suppressor of cytokine signaling-1 overexpression protects pancreatic beta cells from CD8+ T cell-mediated autoimmune destruction. J. Immunol. 172:5714–5721 - PubMed
Publication types
MeSH terms
Substances
Grants and funding
- 5T32 AI 07411/AI/NIAID NIH HHS/United States
- AI07272/AI/NIAID NIH HHS/United States
- R01 AI071272/AI/NIAID NIH HHS/United States
- T32 AI007272/AI/NIAID NIH HHS/United States
- R01 AI061061/AI/NIAID NIH HHS/United States
- T32 AI007411/AI/NIAID NIH HHS/United States
- R56 AI061061/AI/NIAID NIH HHS/United States
- AI061061/AI/NIAID NIH HHS/United States
LinkOut - more resources
Full Text Sources
Other Literature Sources
Molecular Biology Databases
Research Materials
