Memory/effector (CD45RB(lo)) CD4 T cells are controlled directly by IL-10 and cause IL-22-dependent intestinal pathology - PubMed (original) (raw)
Memory/effector (CD45RB(lo)) CD4 T cells are controlled directly by IL-10 and cause IL-22-dependent intestinal pathology
Masahito Kamanaka et al. J Exp Med. 2011.
Abstract
The role of direct IL-10 signaling in different T cell subsets is not well understood. To address this, we generated transgenic mice expressing a dominant-negative IL-10 receptor specifically in T cells (CD4dnIL-10Rα). We found that Foxp3-depleted CD45RB(lo) (regulatory T cell [T(reg) cell]-depleted CD45RB(lo)) but not CD45RB(hi) CD4(+) T cells are controlled directly by IL-10 upon transfer into Rag1 knockout (KO) mice. Furthermore, the colitis induced by transfer of T(reg) cell-depleted CD45RB(lo) CD4(+) T cells into Rag1 KO mice was characterized by reduced Th1 and increased Th17 cytokine messenger RNA levels in the colon as compared with the colitis induced by transfer of CD45RB(hi) T cells. In contrast to the CD45RB(hi) transfer colitis model, in which IL-22 is protective, we found that T cell-derived IL-22 was pathogenic upon transfer of T(reg) cell-depleted CD45RB(lo) T cells into Rag1 KO mice. Our results highlight characteristic differences between colitis induced by naive (CD45RB(hi)) and memory/effector (T(reg) cell-depleted CD45RB(lo)) cells and different ways that IL-22 impacts inflammatory bowel disease.
Figures
Figure 1.
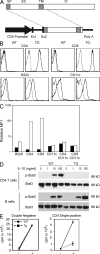
Generation of dominant-negative IL-10Rα TG mice. (A) Construct used for the generation of IL-10Rα dominant-negative mice. Signal peptide (SP), extracellular (EX), transmembrane (TM), and intracellular (IC) regions are shown. Ex1 and Ex2 are the exons of the CD4 promoter region. (B) Expression analysis of IL-10Rα in the dominant-negative TG mice in splenocytes. IL-10Rα expression (solid lines) was analyzed using flow cytometry. PE-conjugated hamster IgG1 was used as a control (dotted lines). (C) Relative mean fluorescence intensity (MFI) from WT mice (closed bars) and TG mice (open bars) shown as a fold increase compared with the control staining. (D) Western blot analysis of Stat3 and phospho-Stat3 (p-Stat3) in CD4 T cells and B cells incubated with the indicated concentration of IL-10. (E) CD4CD8 double–negative cells and CD4 single–positive cells were isolated from the thymus of WT and TG mice using FACS, and 105 cells were incubated with or without 100 ng/ml IL-10 for 5 d (indicated as + and −). [3H]thymidine was added during the last 16 h of culture, and 3H uptake was measured (mean ± SD of the triplicates). Results are representative of two experiments.
Figure 2.
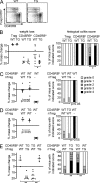
IL-10 controls CD45RBlo cells upon transfer into Rag1 KO mice. (A) 106 CD4 T cells were adoptively transferred into Rag1 KO mice, and the weight changes were monitored (TG, dotted line with open circles; WT, solid line with closed circles; TG, n = 5; WT, n = 5; *, P < 0.05). † indicates the experiment was stopped because of the severe colitis in mice receiving CD4dnIL-10Rα T cells. (B) The histological colitis scores of colons after the adoptive transfer of total CD4+ T cells (*, P < 0.05). (C) Representative dot plots showing the sorting gates for CD45RBhi or CD45RBlo cells in CD4 T cells from WT and CD4dnIL-10Rα mice. (D) 5 × 10⁵ CD4+ CD45RBhi cells were adoptively transferred into Rag1 KO mice, and weight changes were monitored (TG, dotted line with open circles; WT, solid line with closed circles). (E) 5 × 10⁵ CD4+ CD45RBlo cells were adoptively transferred into Rag1 KO mice, and weight changes were monitored (open circles, mice transferred with TG cells, n = 4; closed circles, mice transferred with WT cells, n = 4; ***, P < 0.0001). (A, D, and E) Error bars represent mean ± SEM. (F and G) Histological findings (G) and colitis score (F) of Rag1 KO transferred with CD4+ CD45RBlo T cells 8 wk after the transfer (WT, n = 14; TG, n = 12; ***, P < 0.0001). Results are representative of at least two independent experiments. Bars, 1,000 µm.
Figure 3.
Foxp3−CD45RBlo T cells are controlled by nTreg cells via IL-10. (A) Representative dot plots showing the sorting gates for WT and CD4dnIL-10Rα CD4 T cell subsets. (B) 3 × 10⁵ nTreg cells, CD45RBhi, and Foxp3−CD45RBlo (Treg cell–depleted CD45RBlo) CD4+ T cells isolated from WT and CD4dnIL-10Rα mice were transferred into Rag1 KO mice. Weight loss and histological colitis score 6 wk after the transfer in the case of CD45RBhi cell and 12 wk after transfer in the case of nTreg cells and Treg cell–depleted CD45RBlo cells are shown. (C) WT and TG nTreg cells were transferred either alone or together with WT CD45RBhi cells into Rag1 KO mice. (D) WT or TG CD45RBhi cells were transferred together with WT nTreg cells into the Rag1 KO mice. WT CD45RBhi cells were also transferred alone as a control. (E) WT or TG Treg cell–depleted CD45RBlo cells were transferred together with WT or TG nTreg cells into Rag1 KO mice. (C–E) Weight change and colitis score 12 wk after the transfer are shown. (B–E) † indicates mice that had to be sacrificed because of the severity of disease. Each dot represents one animal. Horizontal bars indicate the mean. The results shown are representative of three experiments. *, P < 0.05; **, P < 0.01.
Figure 4.
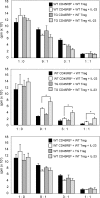
IL-10 signaling in Foxp3-depleted CD45RBlo T cells is important for their complete suppression by nTreg cells in the presence of IL-23 in vitro. WT or TG CD45RBhi cells (top), WT or TG CD4+Foxp3−CD45RBlo (Treg cell–depleted CD45RBlo) cells (middle), or WT CD45RBhi cells (bottom) were cultured with WT or TG nTreg cells in the presence or absence of IL-23. [3H]thymidine was added during the last 16 h of culture, and 3H uptake was measured. Results are representative of three experiments. Error bars represent mean ± SEM. *, P < 0.05.
Figure 5.
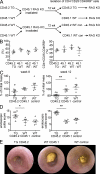
Increased pathogenicity of TG CD25−CD45RBlo cells is caused by a cell-intrinsic effect. (A) Mixed bone marrow chimeras were generated by the cotransfer of bone marrow derived from CD45.1 WT and CD45.2 WT or CD45.2 TG mice into sublethally irradiated CD45.1 Rag1 KO mice. 12 wk after the transfer, CD4+CD25−CD45RBlo (Treg cell–depleted CD45RBlo) expressing either CD45.1 or CD45.2 were isolated from the spleen of chimeric mice and transferred into another Rag1 KO recipient (2 × 10⁵). (B) Frequency of CD45.2- and CD45.1-positive cells within CD4 T cells and of CD4+CD25−CD45RBlo cells gated on CD4+CD45.1 or CD4+CD45.2 cells in the spleen of chimeric mice 12 wk after transfer. (C and D) Mass loss (C) and endoscopic colitis score (D) of Rag1 KO recipients 8 and 12 wk after the transfer of CD4+CD25−CD45RBlo cells isolated from the mixed bone marrow chimera (WT control, Rag1 KO mice receiving CD45.2 or CD45.1 WT cells isolated from the WT control chimera). (E) Representative endoscopic findings 12 wk after the transfer. Results were combined from two independent experiments. Each dot represents one animal. Error bars represent mean ± SEM. *, P < 0.05; **, P < 0.01.
Figure 6.
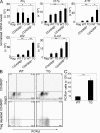
Increased Th17 cell cytokine profile in the inflamed colon of Rag1 KO mice adoptively transferred with Foxp3−CD45RBlo cells compared with recipients of CD45RBhi cells. (A) mRNA levels of the indicated cytokines were measured in total colon extracts of untreated or Rag1 KO mice adoptively transferred with WT or TG CD45RBhi or CD4+Foxp3−CD45RBlo (Treg cell–depleted CD45RBlo) cells. mRNA levels were normalized to HPRT. Results shown represent the mean of four to eight mice per group. The experiments were repeated twice with similar results. Mononuclear cells were isolated from the colon of Rag1 KO mice (CD45.1+) adoptively transferred with WT or TG CD45RBhi or Treg cell–depleted CD45RBlo cells (CD45.2+) 4–8 wk after the transfer. (B) Representative dot blots for ROR-γt and Foxp3 expression (top, Rag1 KO mice received CD45RBhi WT or TG cells; bottom, Rag1 KO mice received WT or TG Treg cell–depleted CD45RBlo cells). Cells were gated on CD45.2+ cells. (C) Number of CD4+ROR-γt+ cells recovered from the colon of Rag1 KO recipients of WT or TG Treg cell–depleted CD45RBlo cells. The experiments were repeated twice with similar results. Error bars represent mean ± SEM. *, P < 0.05; **, P < 0.01.
Figure 7.
IL-10 does not inhibit the differentiation of naive T cells into Th17 cells but decreases Rorc expression in the Treg cell–depleted CD45RBlo T cells in vitro. (A) Naive T cells were cultured for 3 d in the presence of 0.5 ng/ml TGF-β1, 10 ng/ml IL-6, and 20 ng/ml IL-23. 100 ng recombinant IL-10 was added as indicated. Rorc mRNA levels normalized to HPRT are shown. IL-17A expression was measured using flow cytometry. (B) CD4+Foxp3 RFP−CD45RBlo cells were sorted using FACS and were in vitro stimulated with IL-23 for 6 h in the presence of different concentrations of recombinant IL-10 as indicated. Rorc and Tbx21 mRNA levels normalized to HPRT are shown. Results are representative of at least two independent experiments. Error bars represent mean ± SEM.
Figure 8.
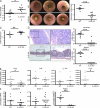
Intestinal pathology induced by CD25−CD45RBlo T cells is dependent on T cell–derived IL-22. CD4+CD25−CD45RBlo (Treg cell–depleted CD45RBlo) cells from C57BL/6 (WT) or _Il22_−/− mice (IL-22 KO) were adoptively transferred into Rag1 KO mice. (A) Percent change from initial mouse weight 13 wk after cell transfer. (B) Selected images from endoscopic colonoscopies performed on the mice at 13 wk after transfer (left) and endoscopic colitis scores (right). (C) Graph represents colon length at 14 wk after transfer. (D) Colon tissue sections were examined by hematoxylin and eosin staining. Shown are representative colon tissues. Colon sections were scored according to the Materials and methods for chronicity (top) and disease activity (bottom). The boxed areas are shown at higher magnification on the right. Bars: (left) 1,000 µm; (right) 400 µm. (E) mRNA levels of different cytokines in the distal colon of the mice. (F) mRNA levels of the indicated IL-22–regulated genes. Each dot represents one mouse; horizontal bars indicate the mean. Results are representative of two experiments. *, P < 0.05; **, P < 0.01; ***, P < 0.001.
Figure 9.
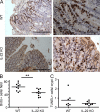
IL-22 promotes cell proliferation in the colon. CD4+CD25−CD45RBlo (Treg cell–depleted CD45RBlo) cells from C57BL/6 (WT) or _Il22_−/− (IL-22 KO) mice were adoptively transferred into Rag1 KO mice. At 14 wk after transfer, 4 h before euthanization, mice were injected with BrdU. Colon sections were stained by immunohistochemistry with an antibody to BrdU. (A) Selected micrographs from two individual mice. Bars: (left) 250 µm; (right) 50 µm. (B) Quantification of the mean number of BrdU+ cells per field for the sections in A. (C) Colonic tissue sections were also subjected to TUNEL staining. TUNEL+ cells per crypt were quantified. Each dot represents one mouse; horizontal bars indicate the mean (BrdU: WT, n = 10; and KO, n = 10; TUNEL: WT, n = 7; and KO, n = 8). Results were confirmed twice using BrdU and Ki67 staining of colon epithelial cells and flow cytometry (shown in
Fig. S6
). **, P < 0.01.
Similar articles
- Extracellular adenosine regulates colitis through effects on lymphoid and nonlymphoid cells.
Kurtz CC, Drygiannakis I, Naganuma M, Feldman S, Bekiaris V, Linden J, Ware CF, Ernst PB. Kurtz CC, et al. Am J Physiol Gastrointest Liver Physiol. 2014 Aug 1;307(3):G338-46. doi: 10.1152/ajpgi.00404.2013. Epub 2014 May 29. Am J Physiol Gastrointest Liver Physiol. 2014. PMID: 24875104 Free PMC article. - Treatment of Intestinal Inflammation With Epicutaneous Immunotherapy Requires TGF-β and IL-10 but Not Foxp3+ Tregs.
Chen X, Berin MC, Gillespie VL, Sampson HA, Dunkin D. Chen X, et al. Front Immunol. 2021 Feb 26;12:637630. doi: 10.3389/fimmu.2021.637630. eCollection 2021. Front Immunol. 2021. PMID: 33717186 Free PMC article. - IL-18Rα-deficient CD4(+) T cells induce intestinal inflammation in the CD45RB(hi) transfer model of colitis despite impaired innate responsiveness.
Holmkvist P, Pool L, Hägerbrand K, Agace WW, Rivollier A. Holmkvist P, et al. Eur J Immunol. 2016 Jun;46(6):1371-82. doi: 10.1002/eji.201545957. Epub 2016 May 6. Eur J Immunol. 2016. PMID: 27062602 - T cell transfer model of chronic colitis: concepts, considerations, and tricks of the trade.
Ostanin DV, Bao J, Koboziev I, Gray L, Robinson-Jackson SA, Kosloski-Davidson M, Price VH, Grisham MB. Ostanin DV, et al. Am J Physiol Gastrointest Liver Physiol. 2009 Feb;296(2):G135-46. doi: 10.1152/ajpgi.90462.2008. Epub 2008 Nov 25. Am J Physiol Gastrointest Liver Physiol. 2009. PMID: 19033538 Free PMC article. Review. - Th17 plasticity and its changes associated with inflammatory bowel disease.
Ueno A, Ghosh A, Hung D, Li J, Jijon H. Ueno A, et al. World J Gastroenterol. 2015 Nov 21;21(43):12283-95. doi: 10.3748/wjg.v21.i43.12283. World J Gastroenterol. 2015. PMID: 26604637 Free PMC article. Review.
Cited by
- Donor interleukin-22 and host type I interferon signaling pathway participate in intestinal graft-versus-host disease via STAT1 activation and CXCL10.
Lamarthée B, Malard F, Gamonet C, Bossard C, Couturier M, Renauld JC, Mohty M, Saas P, Gaugler B. Lamarthée B, et al. Mucosal Immunol. 2016 Mar;9(2):309-21. doi: 10.1038/mi.2015.61. Epub 2015 Jul 8. Mucosal Immunol. 2016. PMID: 26153763 - The immunobiology of colitis and cholangitis in interleukin-23p19 and interleukin-17A deleted dominant negative form of transforming growth factor beta receptor type II mice.
Ando Y, Yang GX, Tsuda M, Kawata K, Zhang W, Nakajima T, Tsuneyama K, Leung P, Lian ZX, Okazaki K, Ridgway WM, Norman GL, Ansari AA, He XS, Coppel RL, Gershwin ME. Ando Y, et al. Hepatology. 2012 Oct;56(4):1418-26. doi: 10.1002/hep.25803. Hepatology. 2012. PMID: 22532156 Free PMC article. - IL-10 engages macrophages to shift Th17 cytokine dependency and pathogenicity during T-cell-mediated colitis.
Li B, Gurung P, Malireddi RK, Vogel P, Kanneganti TD, Geiger TL. Li B, et al. Nat Commun. 2015 Jan 21;6:6131. doi: 10.1038/ncomms7131. Nat Commun. 2015. PMID: 25607885 Free PMC article. - Interleukin‑22 regulates the homeostasis of the intestinal epithelium during inflammation.
Zhang X, Liu S, Wang Y, Hu H, Li L, Wu Y, Cao D, Cai Y, Zhang J, Zhang X. Zhang X, et al. Int J Mol Med. 2019 Apr;43(4):1657-1668. doi: 10.3892/ijmm.2019.4092. Epub 2019 Feb 7. Int J Mol Med. 2019. PMID: 30816423 Free PMC article. - Suppression of Th1 cytokine production by a peptide derived from C4b.
Takeda Y, Kaneda K, Jimma F, Shiobara N, Saniabadi AR, Wakabayashi I. Takeda Y, et al. Inflamm Res. 2013 Nov;62(11):951-9. doi: 10.1007/s00011-013-0650-z. Epub 2013 Aug 25. Inflamm Res. 2013. PMID: 23979690
References
- Asseman C., Read S., Powrie F. 2003. Colitogenic Th1 cells are present in the antigen-experienced T cell pool in normal mice: control by CD4+ regulatory T cells and IL-10. J. Immunol. 171:971–978 - PubMed
Publication types
MeSH terms
Substances
Grants and funding
- AI36529/AI/NIAID NIH HHS/United States
- HHMI/Howard Hughes Medical Institute/United States
- DK45735/DK/NIDDK NIH HHS/United States
- P30 DK045735/DK/NIDDK NIH HHS/United States
- P01 AI036529/AI/NIAID NIH HHS/United States
LinkOut - more resources
Full Text Sources
Other Literature Sources
Molecular Biology Databases
Research Materials
