Role of AP1 and Gadkin in the traffic of secretory endo-lysosomes - PubMed (original) (raw)
Role of AP1 and Gadkin in the traffic of secretory endo-lysosomes
Karine Laulagnier et al. Mol Biol Cell. 2011.
Abstract
Whereas lysosome-related organelles (LRO) of specialized cells display both exocytic and endocytic features, lysosomes in nonspecialized cells can also acquire the property to fuse with the plasma membrane upon an acute rise in cytosolic calcium. Here, we characterize this unconventional secretory pathway in fibroblast-like cells, by monitoring the appearance of Lamp1 on the plasma membrane and the release of lysosomal enzymes into the medium. After sequential ablation of endocytic compartments in living cells, we find that donor membranes primarily derive from a late compartment, but that an early compartment is also involved. Strikingly, this endo-secretory process is not affected by treatments that inhibit endosome dynamics (microtubule depolymerization, cholesterol accumulation, overexpression of Rab7 or its effector Rab-interacting lysosomal protein [RILP], overexpression of Rab5 mutants), but depends on Rab27a, a GTPase involved in LRO secretion, and is controlled by F-actin. Moreover, we find that this unconventional endo-secretory pathway requires the adaptor protein complexes AP1, Gadkin (which recruits AP1 by binding to the γ1 subunit), and AP2, but not AP3. We conclude that a specific fraction of the AP2-derived endocytic pathway is dedicated to secretory purposes under the control of AP1 and Gadkin.
Figures
FIGURE 1:
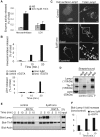
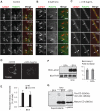
Ionomycin-induced release of hexosaminidase and transport of Lamp1 to the plasma membrane. (A and B) A431 cells (A) or BHK cells (B) were stimulated with 5 μM ionomycin (Iono) or not (NS) for the indicated time. Then hexosaminidase or LDH activity was measured in the medium and in total cell lysates. The enzyme activity released in the medium is expressed as a percentage of the total activity in lysates. (A) shows the mean ± SEM of five and four experiments for hexosaminidase and LDH, respectively, and (B) shows typical kinetics of ionomycin stimulation with or without 1 mM EGTA. No LDH release was observed before 10 min of ionomycin stimulation. (C) BHK cells were stimulated or not as in A and incubated on ice with anti-Lamp1 antibodies without permeabilization (left column, “cell surface Lamp1”), fixed with PFA and labeled with fluorescent secondary antibody. Pictures after Z-stacking show homogeneous Lamp1 distribution on the cell surface (“Basal”) and a clear peripheral labeling at the equatorial Z-position (“Equatorial”). Alternatively, cells were fixed, permeabilized, and labeled with anti-Lamp1 antibodies to reveal total Lamp1 (right column). After stimulation, we observed little change in the distribution of intracellular Lamp1, but peripheral labeling was sometimes observed (arrowhead) as shown in the high magnification view of the boxed area. Bars = 5 mm. (D–F) After stimulation as in A and B, cell surface proteins of BHK (D) or A431 (E and F) were biotinylated (“Biot”) on ice and lysed. In controls, the biotinylation agent was omitted (NoB). Lysates were incubated with streptavidin-coated beads, and bound biotinylated proteins (“strepta-bound”) were eluted, separated by SDS gel, and analyzed by Western blotting using the indicated antibodies. (D) 3% and (E) 2% from nonstimulated lysates were separated in parallel. (F) The experiment in E was quantified, and the ratio of stimulated versus nonstimulated biotinylated-Lamp1 signals is shown. The results were normalized to biot-TfnR signal and are expressed as “fold increase.”
FIGURE 2:
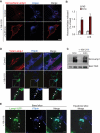
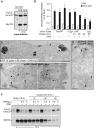
Cholesterol accumulation does not impair the release of hexosaminidase and the transport of Lamp1 to the plasma membrane. (A) BHK cells treated with 3 mg/ml U18666A for 16 h (“16h U18”) were stimulated or not with ionomycin as in Figure 1A, labeled with anti-Lamp1 antibodies before fixation, and stained with filipin to reveal cholesterol. Bars = 10 μm. (B and C) Cells were treated with U18666A before stimulation with ionomycin as in (A), and hexosaminidase release (B) was measured as in Figure 1A. Mean ± SEM of three experiments is shown. In parallel, cell surface biotinylation (C) was analyzed as in Figure 1D. (D) Control cells or cells treated with U18666A were fixed, permeabilized, and double-labeled with filipin and anti-Lamp1 antibodies. High magnification view of the boxed area shows Lamp1-positive structures in the cell periphery that are not labeled by filipin (arrowheads). (E) BHK cells were transfected with Lamp1-GFP, treated with U18666A, fixed, and labeled with filipin. Basal slice of Z-stacking is shown in comparison to an equatorial Z slice (right panel, only merge shown). Arrowheads point at peripheral Lamp1-GFP structures devoid of cholesterol.
FIGURE 3:
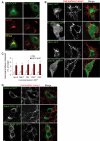
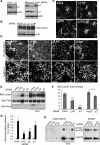
Endo-lysosomal exocytosis is not under the control of Rab7, RILP, or Rab5. (A) BHK cells overexpressing WT Rab7-GFP or WT RILP-GFP were fixed, permeabilized, and labeled with anti-Lamp1 antibody. (B) Cells overexpressing the indicated constructs were stimulated as in Figure 1A, and then cell surface Lamp1 was revealed as in Figure 1C. (C) After stimulation, hexosaminidase release was measured in cells overexpressing the indicated constructs as in Figure 1A (mock: mock-treated; DN, dominant-negative mutant Rab7-N125I; C33, deletion mutant RILP-C33). Means ± SEM of three experiments are shown. (D) A431 cells overexpressing GFP-tagged WT, constitutively active Q79L mutant or dominant-negative S34N mutant Rab5 were treated as in (B). Bars = 10 mm.
FIGURE 4:
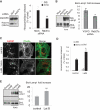
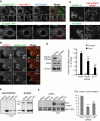
Role of Rab27a and F-actin in the release of hexosaminidase and the transport of Lamp1 to the plasma membrane. (A and B) A431 cells were transfected with siRNA against human Rab27a and analyzed by Western blot (≈85% KD efficiency). The top band in panel A shows a cross-reaction of the antibody. Hexosaminidase release (A) and Lamp1 appearance on the plasma membrane after cell-surface biotinylation (B) were measured as in Figure 1, A, E, and F, respectively. A and B show the means ± SEM of four experiments. *p < 0.04, **p < 0.025. (C) A431 cells were treated for 15 min with 1 nM Latrunculin B before stimulation with 2.5 μM ionomycin. Cells were fixed in PFA, permeabilized, and labeled with Alexafluor 488 Phalloïdin and anti-Lamp1 antibody. Bar = 10 μm. (D and E) Cells were treated as in (C), and then the release of hexosaminidase (D) and Lamp1 appearance on the plasma membrane after cell surface biotinylation (E) were measured as in Figure 1, A, E, and F, respectively. (D and E) *p < 0.04; **p < 0.025.
FIGURE 5:
Regulation of endo-lysosomal exocytosis is controlled by Rab27a and is BFA-insensitive. (A and B) Living A431 cells overexpressing Rab27a-GFP (green) and Lamp1-cherry (red) were imaged by time-lapse TIRF microscopy at room temperature for 5 min without (A, control, see Supplemental Movie 5) or with 2.5 mM ionomycin (B, 2.5 μM Iono; see Supplemental Movie 1). Snapshots are shown for the indicated time points. Arrows point at a motile vesicle containing Rab27a and Lamp1, and an arrowhead points at an immobile reference in each frame. Bar = 2.5 μm. (C) As in (A), except that cells were pretreated with U18666A as in Figure 2A. Snapshots of Supplemental Movie 4 are shown for the indicated time points. Bar = 5 μm. (D--G) A431 cells were treated or not with 5 μg/ml BFA for 1 h before stimulation. (D) Cells were fixed, permeabilized, and labeled with anti-TGN38 antibody to monitor BFA effect. After BFA treatment, hexosaminidase release (E) was measured as in Figure 1A (means ± SEM of three experiments) or (F) cell surface proteins were biotinylated and analyzed as in Figure 1D. Panel F shows a representative blot and the quantification of three experiments (means ± SEM). (G) After stimulation, total proteins from cell supernatants were precipitated with TCA and blotted against cathepsin D (CD). Three percent of nonstimulated cell lysate was analyzed for comparison. The three cathepsin D isoforms are indicated on the blot.
FIGURE 6:
Identification of the endocytic organelles competent for secretion. (A) A431 cells were incubated with Tfn-HRP for 15 min at 37°C. Cells were treated without or with DAB–H2O2 as indicated to inactivate the compartment by cross-linking, and then stimulated or not with 5 μM ionomycin. Soluble proteins in the medium were precipitated with TCA and analyzed by Western blotting. We used antibodies that recognize the three main forms of cathepsin D (preCD, immature CD, mature CD) indicated on the figure. Note that this antibody recognized the precursor form with variable affinity. (B) A431 cells were incubated with Tfn-HRP or HRP (0.5 or 5 g/l as indicated) for 15 min at 37°C. Then endosomes containing HRP were cross-linked (DAB) as in A, or HRP was chased in HRP-free medium for the indicated time before cross-linking. After stimulation, hexosaminidase release was measured as in Figure 1A. The graph shows the means ± SEM of three Tfn-HRP experiments and four HRP experiments, except after a 30-min chase (two experiments). **p < 0.025, ***p < 0.0025. Student's t test was done in comparison to the control condition with DAB only. (C) HRP (10 g/l) was endocytosed into BHK cells for 15 min at 37°C and then chased for 90 min, as in A. Samples were treated with DAB–H2O2 and processed for electron microscopy. Bar = 0.5 μm. (D–E) BHK cells overexpressing Rab27-GFP were incubated with HRP as in (B), and were processed for cryosectioning and immunogold labeling using antibodies (D) against GFP (arrows) and Lamp1 (arrowheads) or (E) against HRP (arrowheads) and GFP (arrows). Bar = 0.2 μm. (F) Cells were incubated with HRP and treated as in A. After stimulation, soluble proteins in the medium were precipitated with TCA, and were analyzed by Western blotting. We used antibodies that recognize cathepsin D mature form (Mat CD, bottom panels) or both pro- and immature forms (Pro- and Imm-CD, top panels). Blots allowed observation of the the main forms of cathepsin D (preCD, immature CD, mature CD) indicated on the figure. Note that the latter antibodies recognized the precursor form with variable affinity.
FIGURE 7:
Role of adaptor protein complexes in calcium-induced exocytosis of endosecretory compartments A431 cells were transfected with siRNAs against the μ chain of AP1, AP2, or AP3 and the KD efficiency was determined by Western blotting (A). Total amount (B) or intracellular distribution (C) of Lamp1 was analyzed in cells depleted for μ1, μ2, or μ3. No difference was observed as compared with control cells. (D) After KD of the indicated μ subunit and stimulation with ionomycin, Lamp1 on the cell surface was labeled as in Figure 1. The micrographs show large overview fields (Bar = 20 μm) obtained with laser scanning a confocal microscope. (E and F) After KD and stimulation as in (D), Lamp1 appearance on the plasma membrane after cell surface biotinylation was analyzed as in Figure 1, E and F. A representative blot is shown in (E), and the data are quantified in (F). Means ± SEM of eight experiments are shown. *p < 0.04, **p < 0.025, ***p < 0.0025. (G and H) After KD and stimulation, hexosaminidase release (G; means of four experiments ± SEM) was measured as in Figure 1A and cathepsin D release (H) was analyzed as in Figure 7C.
FIGURE 8:
Gadkin regulates endo-lysosome exocytosis. (A) Cells transfected with GFP-tagged WT Gadkin (top panel) or Δ4 Gadkin mutant unable to bind AP1γ1 (bottom panel) were fixed, permeabilized, and labeled with anti-AP1γ1 (red) and anti-Lamp1 (blue) antibodies. (B) Cells transfected with WT Gadkin and Lamp1-Cherry were analyzed by time-lapse TIRF microscopy in vivo. Screen captures of Supplementary Movie 6 are shown at the indicated time points. Arrowheads point at structures where Lamp1 and Gadkin are colocalized. Bar = 2.5 μm. (C) Cells transfected as in A were stimulated with ionomycin, and cell surface Lamp1 was labeled as in Figure 1E. Bars = 10 μm (D–F) Cells were transfected with siRNAs against Gadkin (D; KD efficiency ≈ 85–90%) or AP1μ1#1 chain as in A. After ionomycin stimulation, hexosaminidase release (D; means ± SEM of three experiments) was measured as in Figure 1A, cathepsin D release (E) was analyzed as in Figure 5, and Lamp1 appearance on the plasma membrane after cell surface biotinylation (F) was analyzed as in Figure 1, E and F. Means ± SEM of three experiments are shown. **p < 0.025, ***p < 0.0025.
FIGURE 9:
Outline of the endosecretory pathway. Endocytic membrane transport from the plasma membrane to early endosomes and then to late endosomes and lysosomes is depicted, as are the proposed roles of AP2, AP1, Gadkin, and Rab27a/actin in endocytosis. We propose that the endosecretory pathway triggered by a transient raise in cytosolic calcium (in blue) bifurcates from the conventional lysosomal pathway at the level of early endosomes.
Similar articles
- Rab24 interacts with the Rab7/Rab interacting lysosomal protein complex to regulate endosomal degradation.
Amaya C, Militello RD, Calligaris SD, Colombo MI. Amaya C, et al. Traffic. 2016 Nov;17(11):1181-1196. doi: 10.1111/tra.12431. Epub 2016 Oct 3. Traffic. 2016. PMID: 27550070 - The endocytic pathway taken by cationic substances requires Rab14 but not Rab5 and Rab7.
Trofimenko E, Homma Y, Fukuda M, Widmann C. Trofimenko E, et al. Cell Rep. 2021 Nov 2;37(5):109945. doi: 10.1016/j.celrep.2021.109945. Cell Rep. 2021. PMID: 34731620 - Endo-lysosomal vesicles positive for Rab7 and LAMP1 are terminal vesicles for the transport of dextran.
Humphries WH 4th, Szymanski CJ, Payne CK. Humphries WH 4th, et al. PLoS One. 2011;6(10):e26626. doi: 10.1371/journal.pone.0026626. Epub 2011 Oct 24. PLoS One. 2011. PMID: 22039519 Free PMC article. - Rab7: role of its protein interaction cascades in endo-lysosomal traffic.
Wang T, Ming Z, Xiaochun W, Hong W. Wang T, et al. Cell Signal. 2011 Mar;23(3):516-21. doi: 10.1016/j.cellsig.2010.09.012. Epub 2010 Sep 21. Cell Signal. 2011. PMID: 20851765 Review. - The biogenesis of lysosomes and lysosome-related organelles.
Luzio JP, Hackmann Y, Dieckmann NM, Griffiths GM. Luzio JP, et al. Cold Spring Harb Perspect Biol. 2014 Sep 2;6(9):a016840. doi: 10.1101/cshperspect.a016840. Cold Spring Harb Perspect Biol. 2014. PMID: 25183830 Free PMC article. Review.
Cited by
- Cyclodextrin triggers MCOLN1-dependent endo-lysosome secretion in Niemann-Pick type C cells.
Vacca F, Vossio S, Mercier V, Moreau D, Johnson S, Scott CC, Montoya JP, Moniatte M, Gruenberg J. Vacca F, et al. J Lipid Res. 2019 Apr;60(4):832-843. doi: 10.1194/jlr.M089979. Epub 2019 Feb 1. J Lipid Res. 2019. PMID: 30709900 Free PMC article. - Cytomegalovirus Generates Assembly Compartment in the Early Phase of Infection by Perturbation of Host-Cell Factors Recruitment at the Early Endosome/Endosomal Recycling Compartment/Trans-Golgi Interface.
Lučin P, Jug Vučko N, Karleuša L, Mahmutefendić Lučin H, Blagojević Zagorac G, Lisnić B, Pavišić V, Marcelić M, Grabušić K, Brizić I, Lukanović Jurić S. Lučin P, et al. Front Cell Dev Biol. 2020 Sep 11;8:563607. doi: 10.3389/fcell.2020.563607. eCollection 2020. Front Cell Dev Biol. 2020. PMID: 33042998 Free PMC article. - MicroRNAs are exported from malignant cells in customized particles.
Palma J, Yaddanapudi SC, Pigati L, Havens MA, Jeong S, Weiner GA, Weimer KM, Stern B, Hastings ML, Duelli DM. Palma J, et al. Nucleic Acids Res. 2012 Oct;40(18):9125-38. doi: 10.1093/nar/gks656. Epub 2012 Jul 5. Nucleic Acids Res. 2012. PMID: 22772984 Free PMC article. - Clathrin and AP-1 regulate apical polarity and lumen formation during C. elegans tubulogenesis.
Zhang H, Kim A, Abraham N, Khan LA, Hall DH, Fleming JT, Gobel V. Zhang H, et al. Development. 2012 Jun;139(11):2071-83. doi: 10.1242/dev.077347. Epub 2012 Apr 25. Development. 2012. PMID: 22535410 Free PMC article. - Mechanism of polarized lysosome exocytosis in epithelial cells.
Xu J, Toops KA, Diaz F, Carvajal-Gonzalez JM, Gravotta D, Mazzoni F, Schreiner R, Rodriguez-Boulan E, Lakkaraju A. Xu J, et al. J Cell Sci. 2012 Dec 15;125(Pt 24):5937-43. doi: 10.1242/jcs.109421. Epub 2012 Oct 4. J Cell Sci. 2012. PMID: 23038769 Free PMC article.
References
- Andrews NW. Regulated secretion of conventional lysosomes. Trends Cell Biol. 2000;10:316–321. - PubMed
- Barral DC, Seabra MC. The melanosome as a model to study organelle motility in mammals. Pigment Cell Res. 2004;17:111–118. - PubMed
Publication types
MeSH terms
Substances
LinkOut - more resources
Full Text Sources
Molecular Biology Databases
Research Materials
Miscellaneous
